
Figure 1. Kinetics of [14C]butyrate uptake and effect of different agents in BCS-TC2 cells.
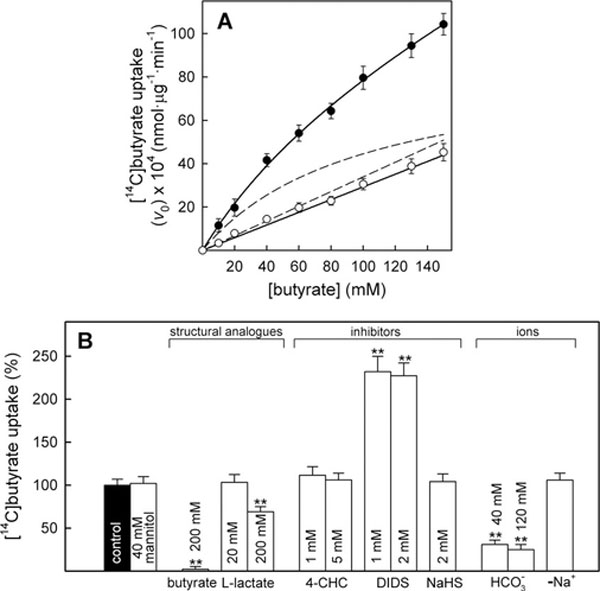
Measurement of butyrate transport at 10–150 mM butyrate. (A) Butyrate transport at 37°C (black circles) and 4°C (white circles). Discontinuous lines represent the non-linear regression of data at 37°C showing a hyperbolic and a linear component. (B) Effect of structural analogues, inhibitors and ions on butyrate uptake. Cells were pre-incubated at the indicated agent concentration or in sodium-free buffer (–Na+) for 15 min before measuring uptake in the presence of 20 mM butyrate. Results shown represent specific uptake expressed as a percentage of the control uptake; results are the means± S.D. for four independent experiments with triplicate samples (**P <0.01).