
Figure 6. Effect of butyrate treatment on its uptake and MCT1 expression in butyrate-sensitive and -resistant cells.
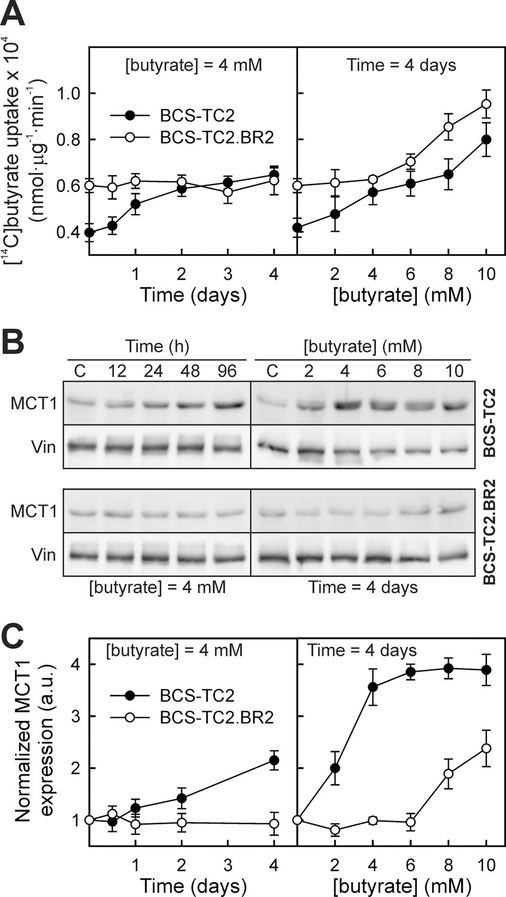
(A) Specific uptake was analysed in BCS-TC2 (black circles) and BCS-TC2.BR2 cells (white circles) after pre-incubation (left panel) up to 4 days in the presence of 4 mM butyrate or (right panel) after 4-day treatment with up to 10 mM butyrate. Results are expressed as a percentage of specific uptake after pre-incubation in the absence of butyrate, and correspond to mean values ± S.D. for three independent experiments with triplicate samples. (B) Representative Western blots corresponding to MCT1 expression under the experimental conditions described in (A). Vinculin (Vin) expression is also shown. (C) Densitometric analysis of MCT1 levels using vinculin expression (a.u., arbitrary units) for normalization. Results correspond to mean values ± S.D. for four independent experiments.