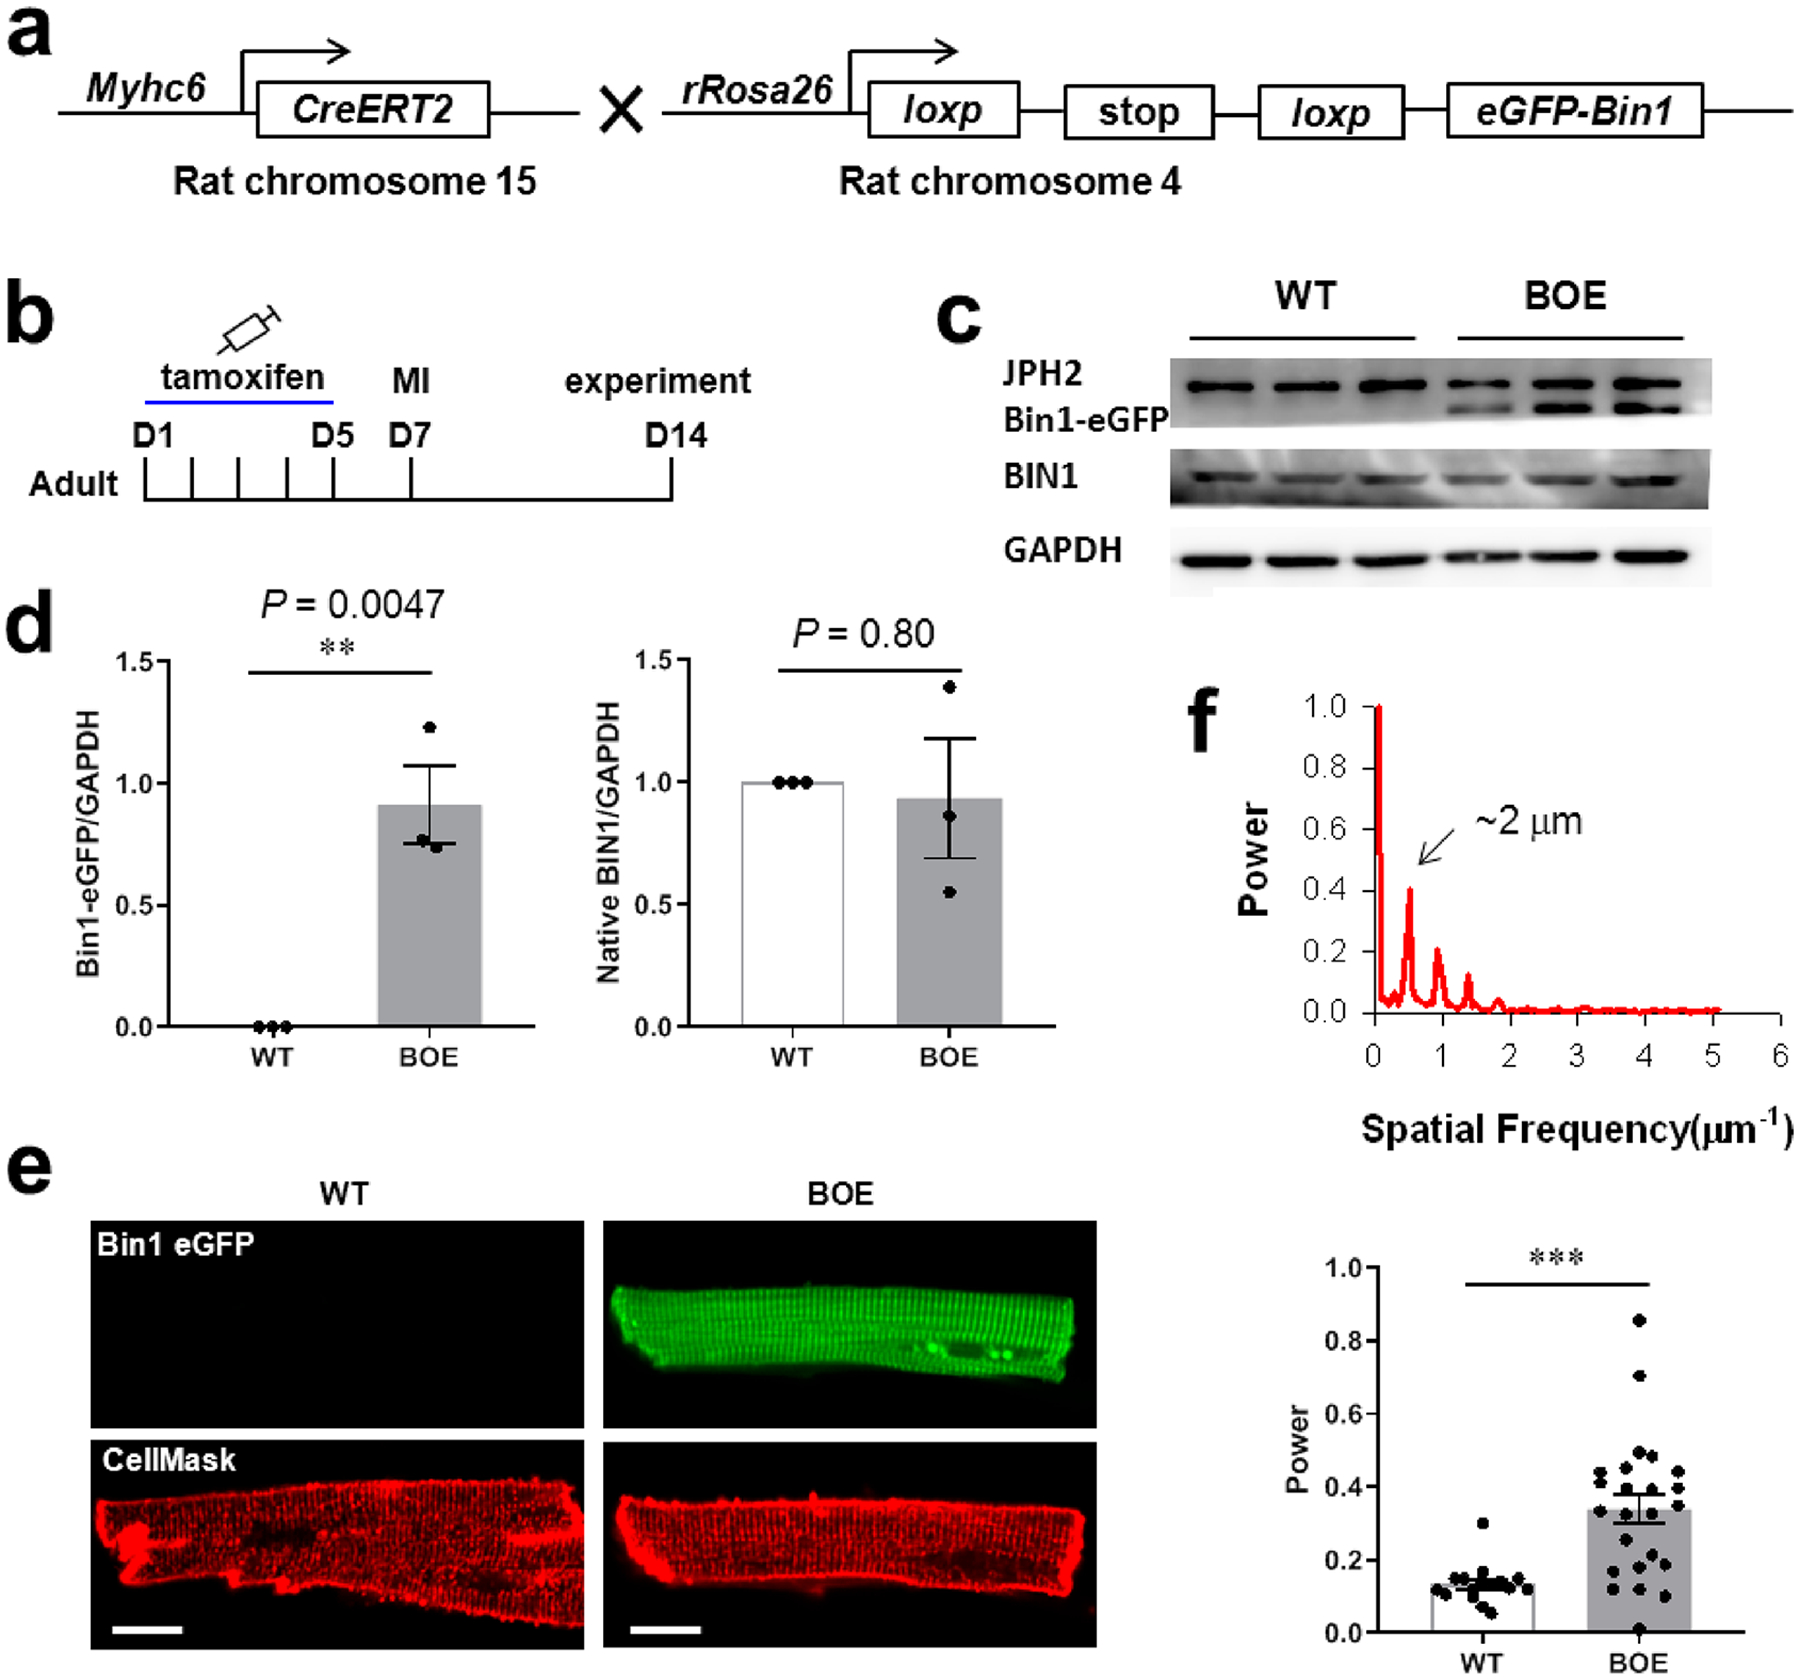
Figure 6.

Overexpression of uBIN1 (BOE) in vivo promoted Z-line positioning of TTs in rat MI model. (a) Schematic illustration of α-MHCCreERT2 (Cre) rats and rROSA26loxp-stop-loxp-eGFP-Bin1 rats, the cross of which produces inducible cardiac-specific BOE rats. (b) Time schedule of tamoxifen injection, MI model generation, and the functional experiments. (c) Typical Western blot images of samples from WT and BOE groups. (d) Comparison of overexpressed uBIN1 (Bin1-eGFP, left) and native total BIN1 (right) protein levels between WT and BOE groups. N = 3, **P < 0.01 vs sham group by t-test. (e) Typical images of eGFP fluorescence (upper) and CellMask Deep Red fluorescence (lower) of the cardiomyocytes form the border zone after MI surgery in WT and BOE rats. Scale bar, 10 μm. (f) Quantification of the spatial frequency by fast Fourier transformation of the cardiomyocytes stained by the CellMask Deep Red dye. The upper panel shows an example of fast Fourier transformation, and the lower panel shows the comparison between WT and BOE groups. N = 16 and 24 cardiomyocytes for WT and BOE groups, respectively. ***P < 0.001 vs WT group by t-test.
