
Figure 1.
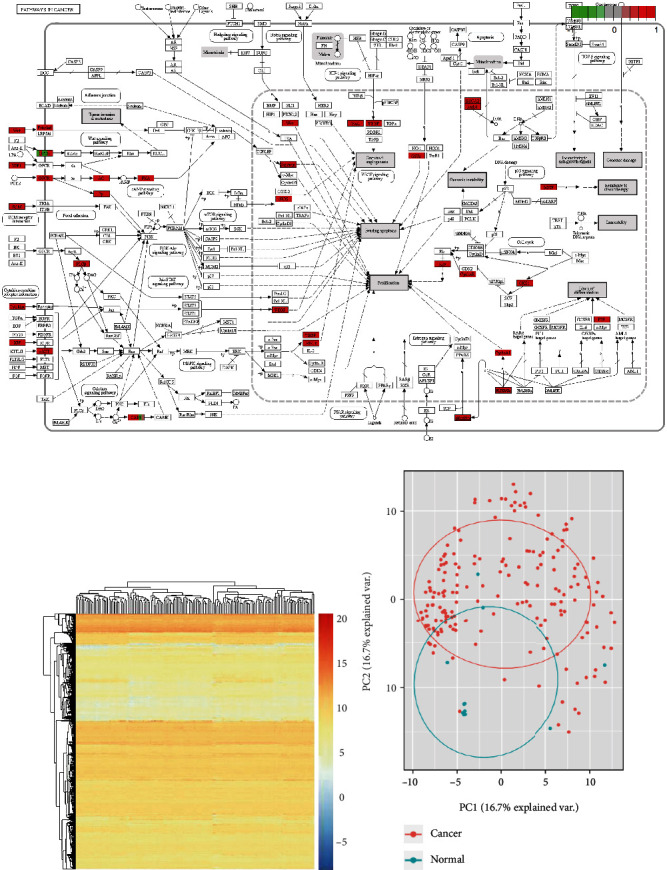
Transcriptome profiles in esophageal carcinoma. (a) Pathways of cancer. up or downregulated DEmRNAs were marked red or green, respectively. (b) The DEmRNAs were shown in heatmap. (c) PCA plot analysis of ESCA and normal samples based on DEmRNAs' expression.