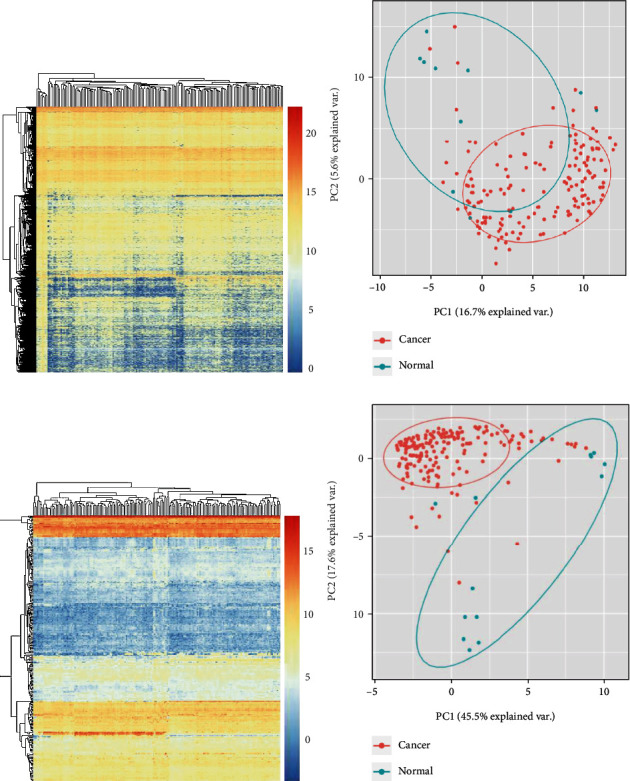
Figure 2.

lncRNA and miRNA profiles in esophageal carcinoma. (a) The DElncRNAs were depicted in heatmap. (b) PCA plots of ESCA and normal samples based on DElncRNAs' expression. (c) The DEmiRNAs were shown in heatmap. (d) PCA plots of ESCA and normal samples based on DEmiRNAs' expression.
