
Figure 5.
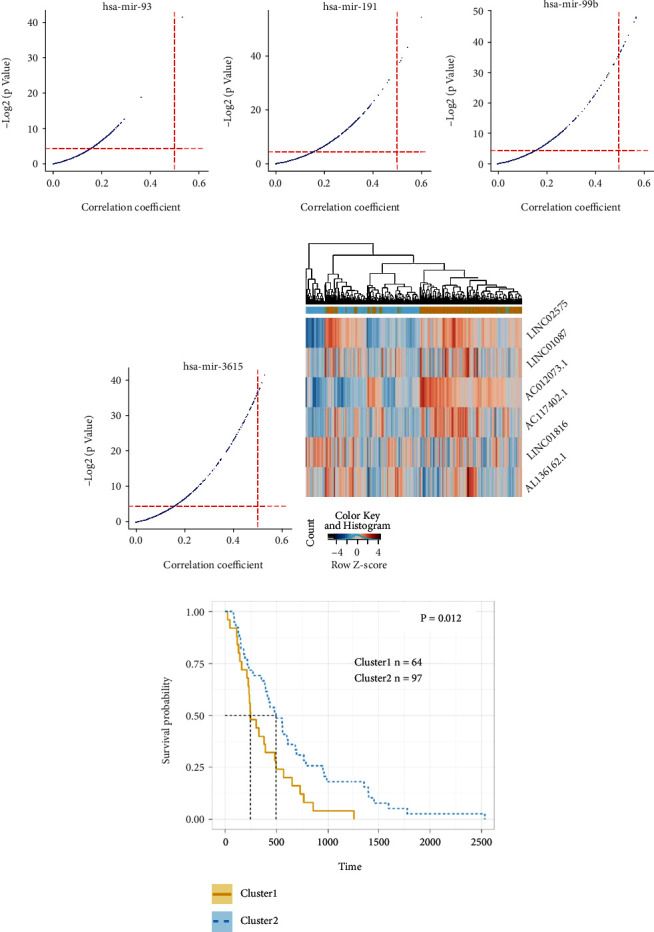
Statistical features of hublncRNAs in esophageal squamous carcinoma. (a)–(d) miRNA and lncRNA coefficiency plot analysis of miR-93 (a), miR-191 (b), miR-99b (c), and miR-3615 (d). (e) Heatmap plot analysis of six hub lncRNAs in ESCA and normal samples. (f) Survival plots of cluster 1 and cluster 2.