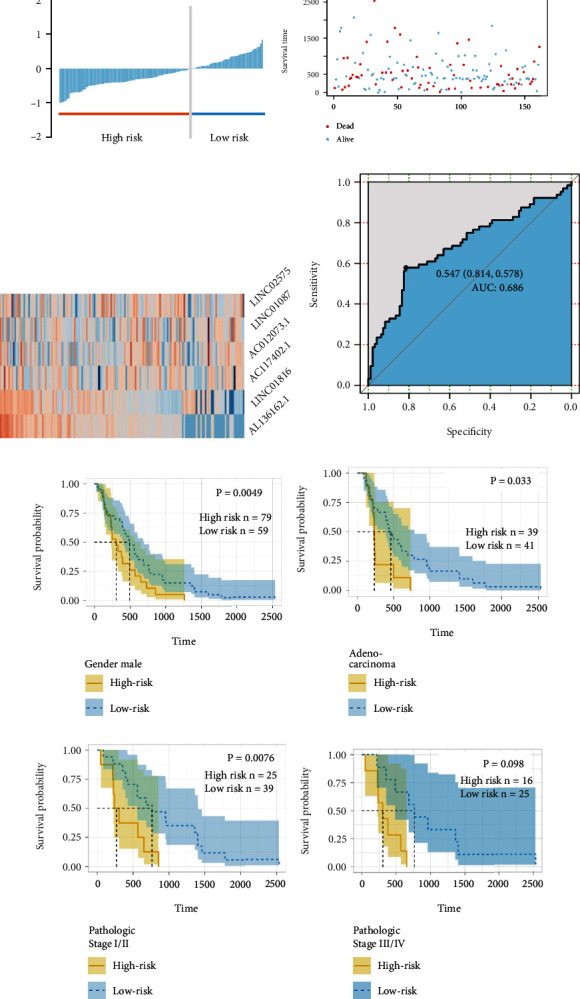
Figure 6.

Clinical prognostic significance of biomarker panel. (a)–(c) Risk distribution plots of biomarker panel. Grey line indicated the cutoff value based on risk scores. (d) ROC plot analysis of biomarker panel in ESCC. (e) Overall survival plot analysis of high-risk and low-risk group in male esophageal cancer patients. (f) Overall survival plots analysis of high-risk and low-risk group in esophageal adenocarcinoma patients. (g) Overall survival plots analysis of high-risk and low-risk group in stage I/II esophageal cancer patients. (h) Overall survival plot analysis of high-risk and low-risk group in stage III/IV esophageal cancer patients.
