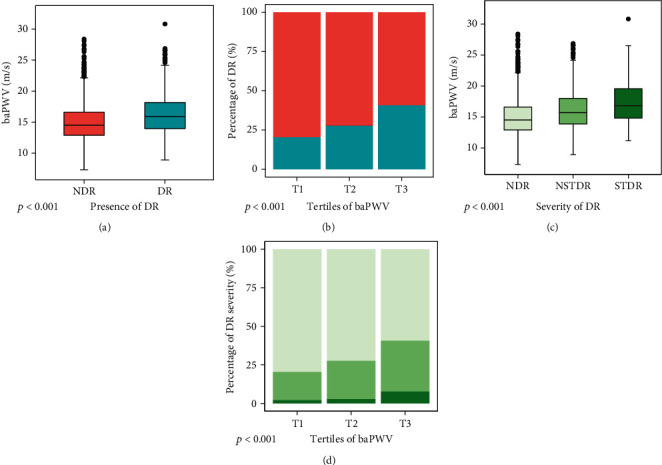
Figure 1.

The associations of baPWV with the presence and severity of DR. Differences in baPWV according to the presence of DR (a) and severity of DR (c) were presented by boxplots. Stacked bar plots (b) showing percentages of the presence (bluish-green bar) and absence of DR (orange bar) stratified by tertiles of baPWV, while similar plots (d) displaying differences in the proportions of severe DR (dark green) and mild DR (medium green) among tertiles of baPWV.
