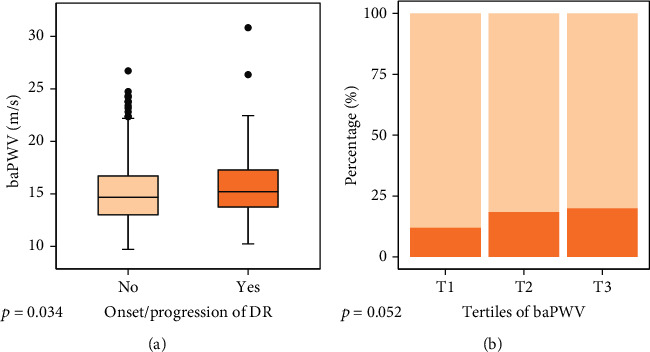
Figure 2.

The relationships between baPWV and new onset/progression of DR: (a) boxplots showing distributions of baPWV between the group without and with new onset/progression of DR; (b) comparisons of the group with (dark orange) and without onset/progression of DR (light orange) based on the tertiles of baPWV were illustrated by stacked bar plots.
