
Fig. 2.
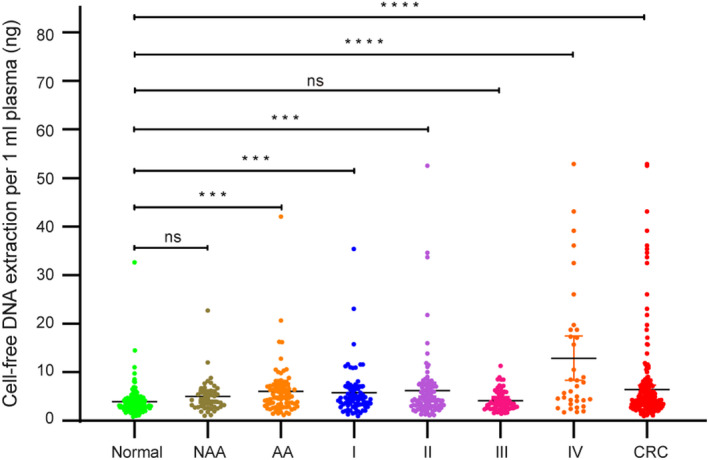
The cfDNA extraction analysis in healthy controls, NAA, AA and CRC patients. A total of 551 (162 Healthy controls [Normal], 44 NAA, 74 AA, 69 CRC stage I [I], 97 CRC stage II [II], 70 CRC stage III [III], 35 CRC stage IV [IV]) cfDNA extraction QC‐qualified samples were measured and compared for the cfDNA concentration (paired Student’s t‐test). Data are shown as mean ± SD; ns, not significant; ***P < 0.001; ****P < 0.0001.