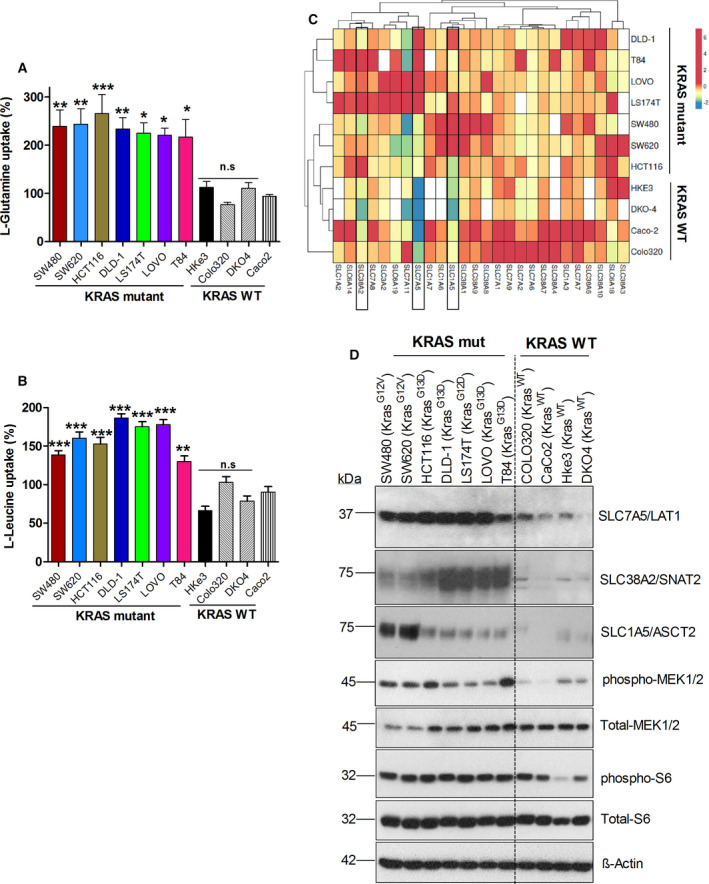
Fig. 1.

Glutamine and leucine uptake in KRAS mutant CRC cells associated with the expression of selected AATs: (A, B) l‐glutamine and l‐leucine uptake levels in KRAS mutant or wt CRC cell lines at 20 min, determined by radiolabeled amino acid transport assay. Data are presented as the mean ± SEM from three independent experiments (n = 3). Statistical comparisons were computed by one‐way ANOVA (*P < 0.05, **P < 0.01, ***P < 0.001). (C) Heat map shows mRNA expression levels (fold change) of SLC‐amino acid transporter genes in different CRC cell lines from three independent biological replicates (n = 3). (D) Western blot images show the protein expression of AATs (SLC38A2, SLC7A5, and SLC1A5), total‐MEK1/2, phospho‐MEK1/2, total ribosomal S6, and phospho‐ribosomal S6 protein in different CRC cell lines. β‐actin was used as protein loading control. All the experiments were performed three times independently, and the blots shown are representative of three independent replicates.
