
Fig. 2.
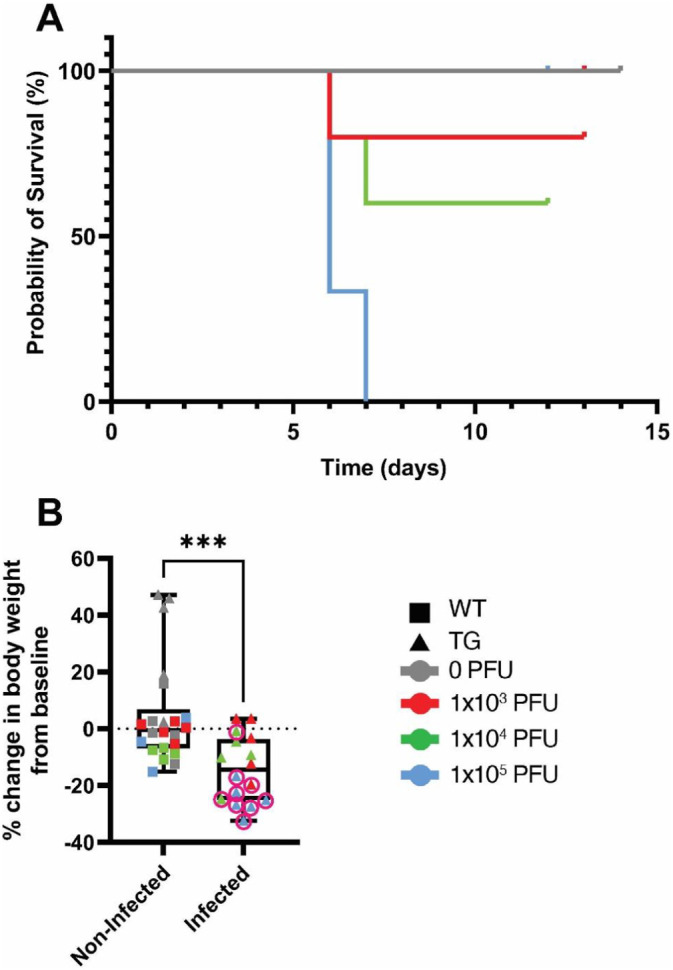
Effects of SARS-CoV-2 infection on survival and body weights in mice. C57BL/6J (WT) and K18-hACE2 (TG) mice were infected with 0, 1 × 10³, 1 × 10⁴, or 1 × 10⁵ PFU of SARS-CoV-2 and survival (A) and the percent change in body weight at euthanasia from baseline (B) were assessed at baseline and daily until humane euthanasia occurred or 12–14 days post infection (n = 4–6/genotype/viral load). A) Kaplan-Meier survival curves. It should be noted that all WT mice (0, 1 × 10³, 1 × 10⁴, or 1 × 10⁵ PFU) and TG mice infected with 0 PFU survived for the entire study and are overlapping the gray line at 100%. Different colored lines represent the different viral infection doses (gray = 0 PFU, red = 1 × 10³ PFU, green = 1 × 10⁴ PFU, blue = 1 × 10⁵ PFU). B) Percent change in body weight at the time of euthanasia from baseline body weight measurements for non-infected (n = 22) and infected mice (n = 16). Data from individual mice are shown. ***p < 0.005 compared to non-infected mice. Statistical analysis was performed using a Student's t-test. (For interpretation of the references to colour in this figure legend, the reader is referred to the web version of this article.)