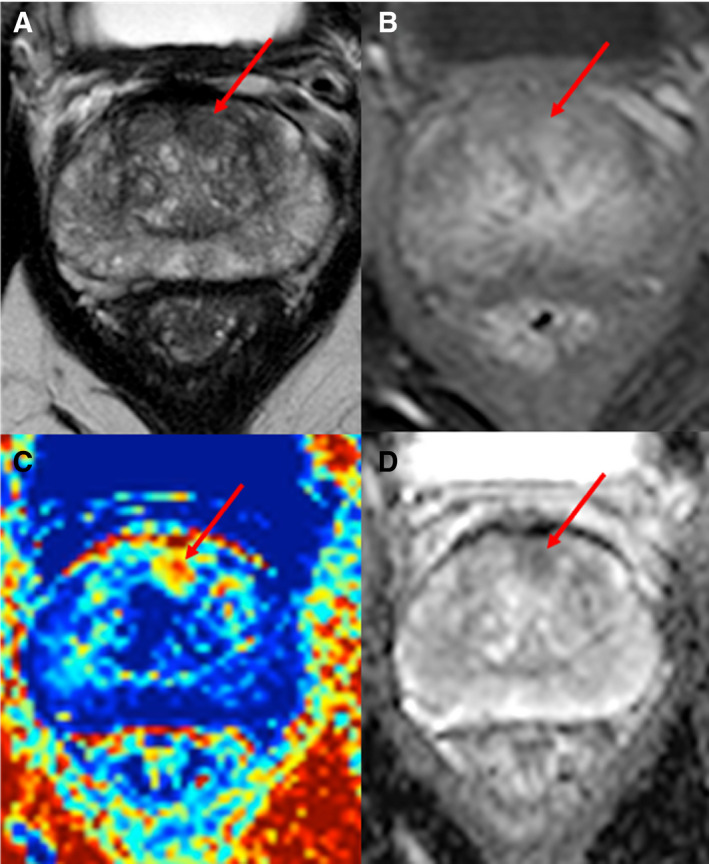
Fig. 2.

MRI images of a 58 years old with biopsy‐proven PCa. (A) An axial T2‐weighted MRI image showing a focus of homogeneous low signal (red arrow) in the left anterior para‐midline transition zone. (B) T1‐weighted, fat‐suppressed, postcontrast image showing focal enhancement (red arrow) in the left anterior transition zone. (C) VERDICT intracellular volume fraction (FIC) map showing a focal area with increased FIC (red arrow), which enables clearer definition of the biopsy‐positive tumour. (D) ADC map showing reduced signal intensity in the tumour (red arrow).
