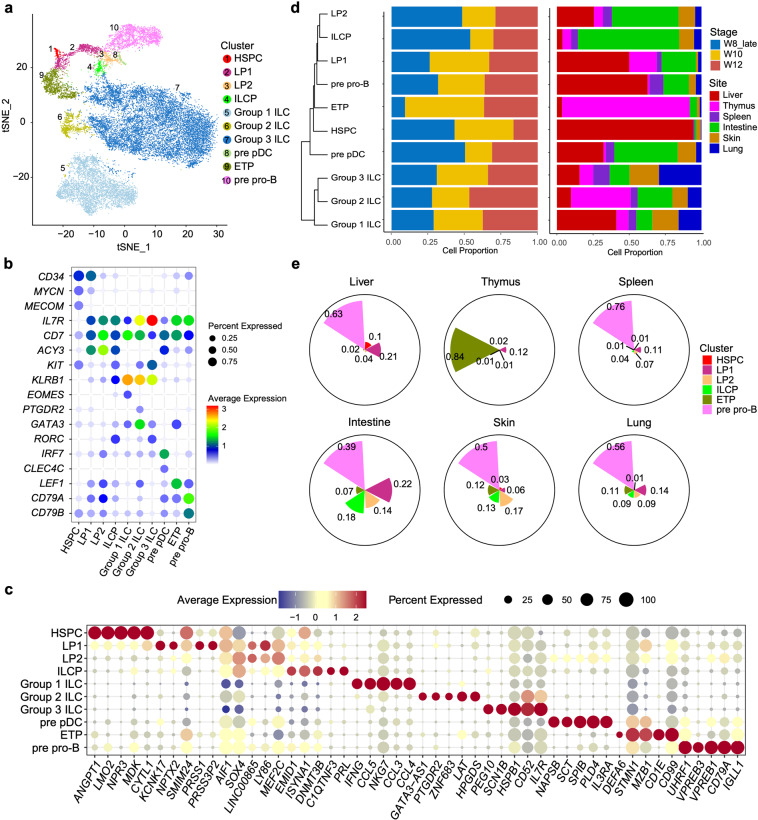
Fig. 2. Single-cell transcriptome profiling of lymphoid-related population in human fetal hematopoietic, lymphoid and non-lymphoid tissues.
at-SNE visualization of ten lymphoid-related cell clusters on the scRNA-seq data of cells isolated from human fetal hematopoietic (liver), lymphoid (thymus and spleen) and non-lymphoid (intestine, skin and lung) tissues at 8,10 and 12 PCW. Color indicates the cell identity. b Dot plots show the featured genes expressed in different cell clusters. Colors represent the average gene expression levels, and size encodes the proportion of gene-expressing cells. c Dot plots show the expression level of the top 5 DEGs of each cell cluster. Colors represent the average expression and size encodes the proportion of gene-expressing cells. d Hierarchical clustering of lymphoid-related cell clusters based on Euclidean distance (left panel). The dynamic change of these populations during embryonic development (middle panel) and their tissue distribution (right panel) are shown in bar graph. Embryonic stages and tissues are indicated by colors. e Pie charts show the proportions of six progenitor clusters in each organ. The radii of sectors indicate proportions of each cell cluster.

