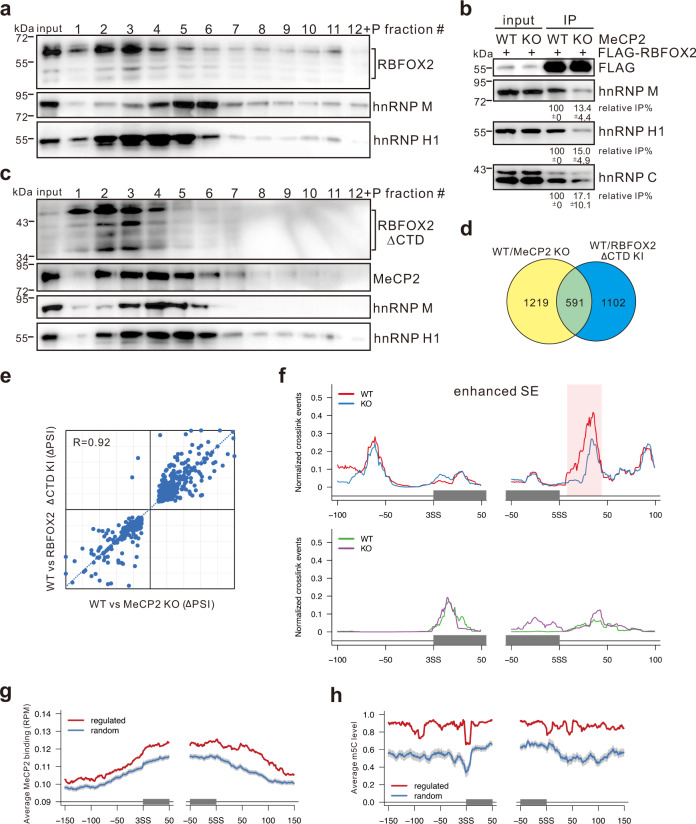
Fig. 3. Loss of MeCP2 results in the dissociation of Rbfox/LASR complex and dysregulation of alternative splicing.
a Sedimentation profiles of RBFOX2, hnRNP M, and hnRNP H1 in HMW extract from MeCP2 KO HEK293T cells on 10–50% glycerol gradients. b FLAG-IP assays performed in WT or MeCP2 KO cells expressing FLAG-tagged RBFOX2 and analyzed by western blot with the indicated antibodies. The average percentages of RBFOX2 IP efficiency with standard deviations in MeCP2 KO cells relative to WT cells are shown below the gel (n = 3 biologically independent experiments). c Sedimentation profiles of RBFOX2 ΔCTD, MeCP2, hnRNP M, and hnRNP H1 in HMW extract from WT or RBFOX2 KI HEK293T cells on 10–50% glycerol gradients. d Venn chart depicting overlapped splicing events between WT vs MeCP2 KO and WT vs RBFOX2 KI. e Scatter plot showing splicing change ΔPSI (percent spliced in) values for overlapped splicing events between WT vs MeCP2 KO and WT vs RBFOX2 KI. f RNA map showing in vivo RBFOX2 binding to pre-mRNAs with skipped exon (SE) splicing pattern regulated by both MeCP2 and RBFOX2/LASR in WT (red or green) or MeCP2 KO (blue or purple) cells determined by iCLIP-seq. Gray boxes represent the alternative exons stimulated (upper) or repressed (lower) by both MeCP2 and RBFOX2/LASR. The red box indicates the region bound by RBFOX2 with significant difference between WT and MeCP2 KO cells (Bonferroni adjusted p value < 0.01 and fold change >2). g, h MeCP2 binding (g) and m5C levels (h) of genomic regions for MeCP2 and RBFOX2/LASR co-regulated splicing events determined by MeCP2 ChIP-seq or WGBS analyses. The red line represents the mean values calculated for the co-regulated events, and the blue line for randomly selected events. The gray shadow represents a 99% confidence interval (CI). Source data are provided as a Source data file.

