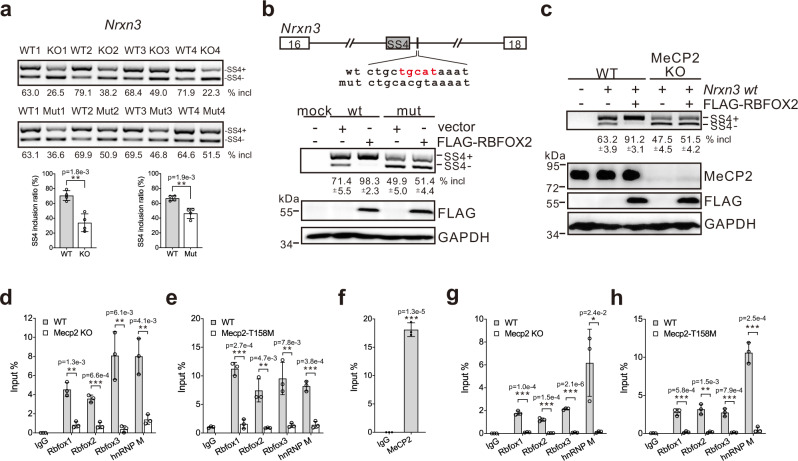
Fig. 5. Regulation of Nrxn3 exon SS4 splicing by Rbfox/LASR in MeCP2 KO and T158M mice.
a Alternative splicing of Nrxn3 in the cerebral cortex of MeCP2 WT, KO, and T158M detected by RT-PCR. The average percentages of exon inclusion with standard deviations are shown below the gel images (n = 4 biological replicates; **p < 0.01, two-sided Student’s t test). b Schematic representation of Nrxn3 minigenes and RT-PCR analysis of in vivo splicing of Nrxn3 minigenes (wt and mut) in HEK293T cells transfected with a vector or a FLAG-RBFOX2 expression construct. The average percentages of exon inclusion with standard deviations are shown below (n = 3 biologically independent experiments). c RT-PCR analysis of in vivo splicing of Nrxn3 wt minigene in WT or MeCP2 KO HEK293T cells transfected with a vector or a FLAG-RBFOX2 expression construct. The average percentages of exon inclusion with standard deviations are shown below (n = 3 biologically independent experiments). d, e CLIP-RT-qPCR analyses of Rbfox proteins and hnRNP M binding to Nrxn3 pre-mRNAs in MeCP2 KO (d) or T158M (e) mice compared to WT mice. f ChIP-qPCR analysis of MeCP2 binding to Nrxn3 genomic locus in WT mice. g, h ChIP-qPCR analyses of Rbfox proteins and hnRNP M associating with Nrxn3 genomic locus in MeCP2 KO (g) or T158M (h) mice compared to WT mice. Error bars in d–h represent standard deviations (n = 3 biologically independent experiments; *p < 0.05, **p < 0.01, ***p < 0.001, two-sided Student’s t test). Source data are provided as a Source data file.

