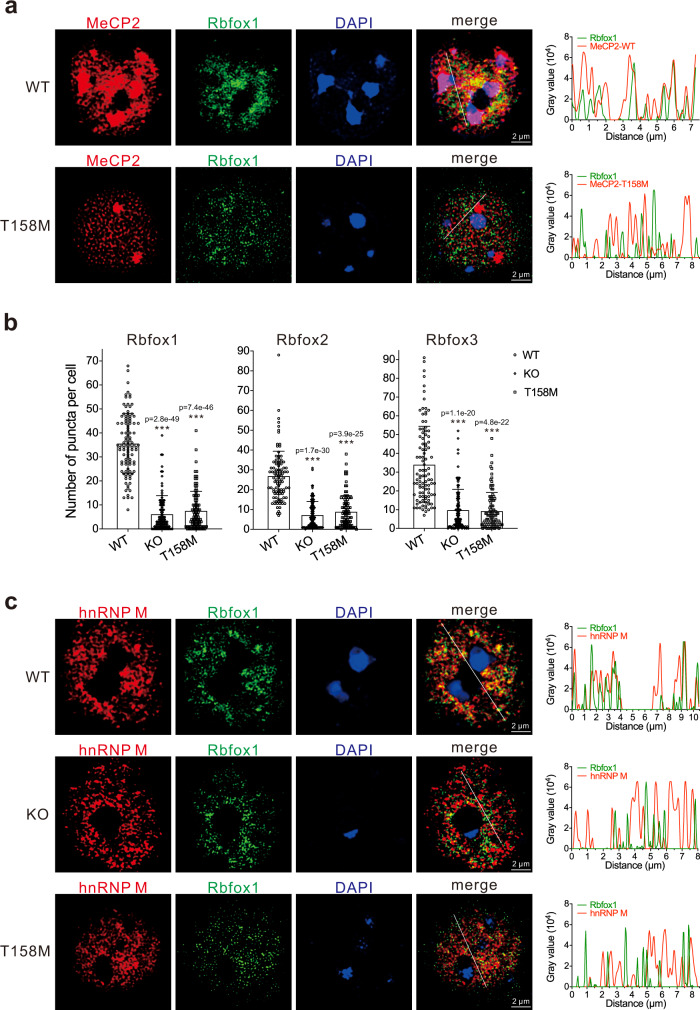
Fig. 7. MeCP2 KO and T158M mice show defects in forming nuclear condensates with Rbfox proteins.
a Representative immunofluorescence microscopic images of endogenous MeCP2 and Rbfox1 in the brains of WT and MeCP2 T158M mice. Scale bar, 2 µm. Line scan graphs are shown on the right. The average Pearson’s R values for MeCP2 and Rbfox1 in WT and T158M mice with standard deviations are 0.58 ± 0.12 and −0.31 ± 0.11, respectively (n = 30 cells, DAPI-bright regions were excluded during quantitation). b The numbers of puncta >0.04 μm2 formed by Rbfox1, Rbfox2, and Rbfox3 were counted per cell. Error bars represent standard deviations (n = 100 cells; ***p < 0.001, two-sided Student’s t test). c Representative immunofluorescence microscopic images of endogenous Rbfox1 and hnRNP M in the brains of WT, MeCP2 KO, and T158M mice. Scale bar, 2 µm. Line scan graphs are shown on the right. The average Pearson’s R values with standard deviations for hnRNP M and Rbfox1 in WT, MeCP2 KO, and T158M mice are 0.43 ± 0.11, −0.06 ± 0.10, and −0.07 ± 0.10, respectively (n = 30 cells). Source data are provided as a Source data file.

