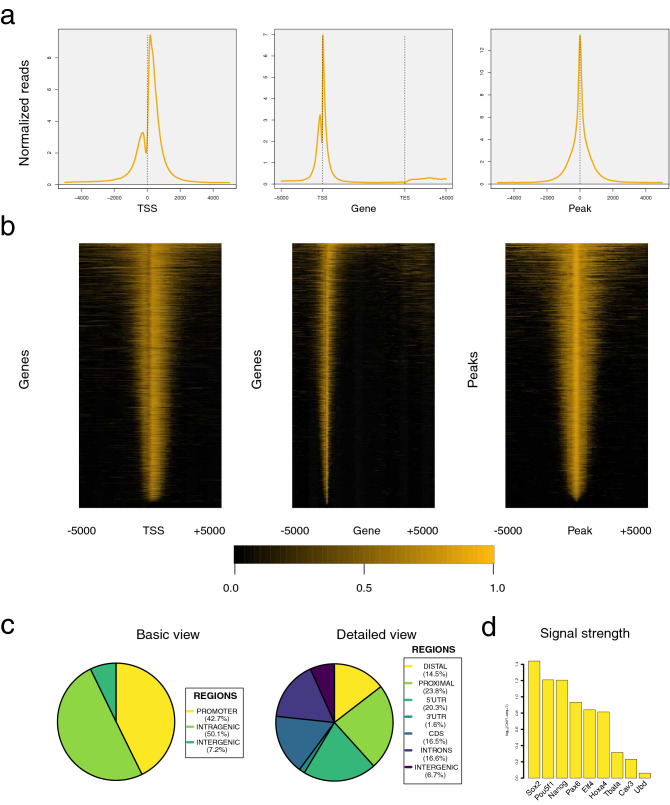
Figure 3.
Basic analysis of the H3K4me3 ChIP-seq sample in mESCs using SeqCode. (a) From left to right: average distributions around the TSS of H3K4me3 target genes (produceTSSplots), along the gene body of the same genes (produceGENEplots), and around the center of H3K4me3 peaks (producePEAKplots). (b) From left to right: heatmap around the TSS of H3K4me3 target genes (produceTSSmaps), along the gene body of the same genes (produceGENEmaps), and around the center of H3K4me3 peaks (producePEAKmaps). (c) Basic and detailed genome distribution of H3K4me3 peaks (genomeDistribution). (d) ChIP-seq signal levels of selected genes (recoverChIPlevels). Raw data were retrieved from32.

