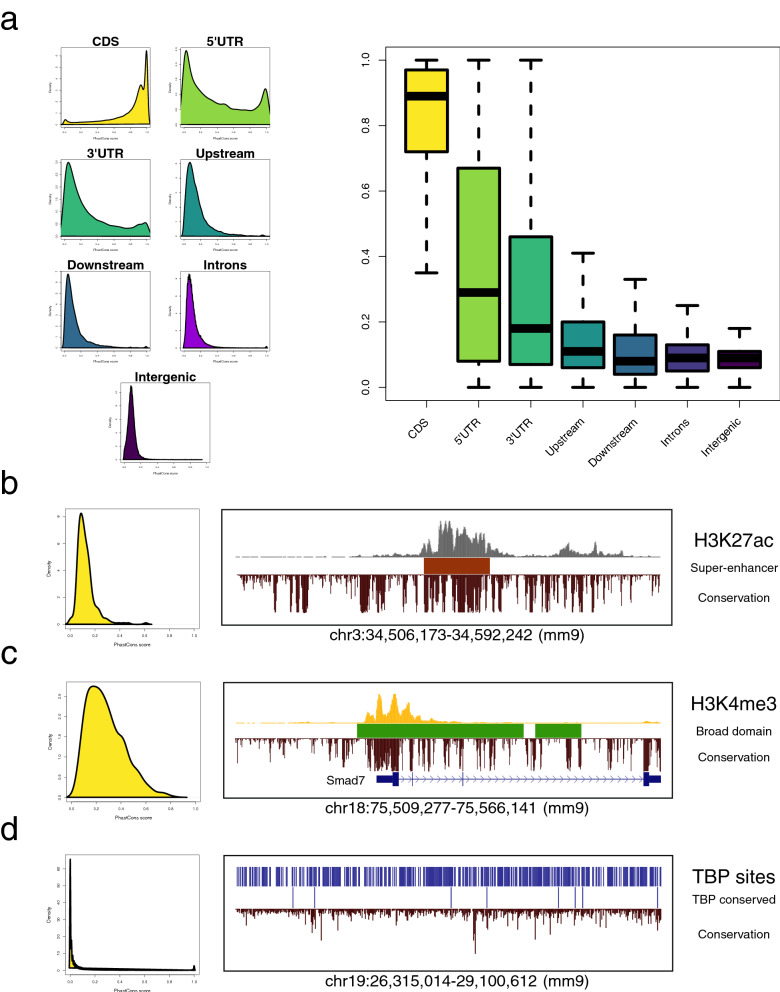
Figure 4.
Evolutionary conservation landscape of distinct features of the mouse genome calculated by SeqCode. (a) PhastCons average score distribution calculated by the SeqCode scorePhastCons function on distinct gene features: protein-coding regions (CDS), 5′ untranslated regions (5′UTR), 3′ untranslated regions (3′UTR), promoters 1000 bp upstream of the TSS (Upstream), regions 1000 bp downstream the TES (Downstream), intronic regions (Introns), and intergenic regions (Intergenic). RefSeq annotations were used to extract the coordinates of all instances of each feature in the mouse genome (mm9). Left, distribution of the score (from 0 to 1); right, boxplot summarizing differences between features. (b–d) PhastCons average score calculated by SeqCode on distinct regulatory features: (b) super-enhancers identified as significant concentrations of H3K27ac in mESCs76, (red); (c) broad domains of H3K4me3 reported in mESCs77 (green); and (d) computational predictions of TATA boxes using Jaspar78, before and after the conservation filtering (TBP and TBP conserved), to highlight the significant drop in the number of ab initio predictions (blue). Left, the global distribution of each class of elements; right, an example of high conservation. The phastCons30way track of mouse was used to score each set of regions with the SeqCode scorePhastCons function. Raw data were retrieved from32,79.

