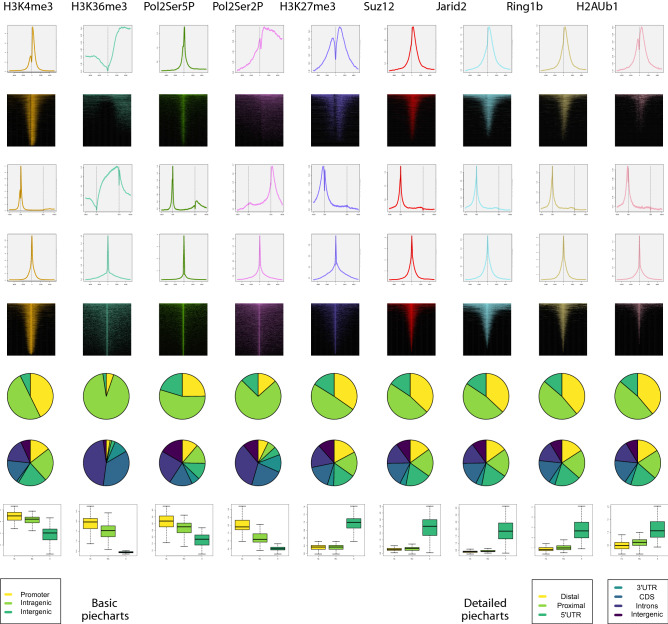
Figure 6.
Panel of active and repressive actors in mESCs generated by SeqCode. For each ChIP-seq signal and corresponding set of target genes, the average distribution (produceTSSplots) and heatmap (produceTSSmaps) around the TSS, average distribution along the gene body (produceGENEplots), average distribution (producePEAKplots) and heatmap (producePEAKmaps) around the center of the peaks, genome distribution of each set of peaks (genomeDistribution), and ChIP-seq levels normalized by the total number of reads (recoverChIPlevels) are shown for 100 highly expressed genes (more than 1000 RPKMs; red), 100 moderately expressed genes (100–500 RPKMs; yellow) and 100 silenced genes (0–1 RPKMs; blue). Raw data were retrieved from32,33,37,38. Target genes of each ChIP-seq were identified with the matchpeaksgenes routine.

