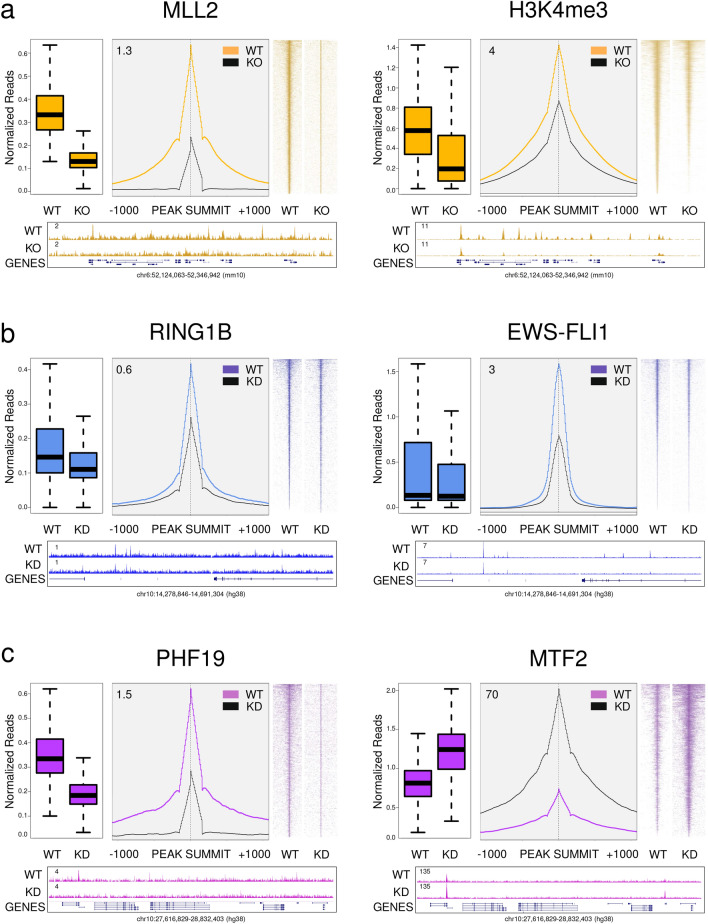
Figure 7.
Evaluation of ChIP-seq experiments after genetic perturbation with SeqCode. (a) Study of the efficiency of MLL2 knockout (KO) in mESCs (left) and its effect over the occupancy pattern of H3K4me3 (right). (b) Study of the efficiency of RING1B knockdown (KD) in the Ewing sarcoma A673 cell line (left) and its effect over the binding pattern of EWS-FLI1 oncogenic protein (right). (c) Study of the efficiency of PHF19 KD in the prostatic cancer DU145 cell line (left) and its effect over the pattern of MTF2 (right). Peaks called in the wild-type (WT) condition of the factor being analyzed on each case were used as a reference in both conditions. For every pair of WT-KO/KD experiments, ChIP-seq normalized levels (recoverChIPlevels), and the average distribution (producePEAKplots) and heatmap (producePEAKmaps) around the peaks are shown. Below, genome-wide screenshots of the WT and KO/KD profiles on a locus containing peaks of this class were generated with the SeqCode buildChIPprofile function. Boxplots of ChIP-seq values are shown in log scale. All samples were normalized by the total number of reads of each experiment, except MTF2 ChIP-seq samples that were normalized by the total number of spike-in fruit-fly reads. Raw data were retrieved from40–42.

