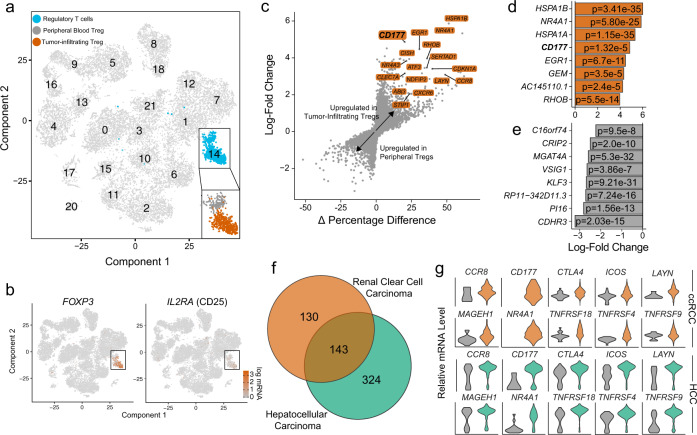
Fig. 1. TI Treg cells display a distinct expression program compared to PB controls in the ccRCC single cell RNA sequencing dataset.
a tSNE projection of immune cells from three ccRCC patients with normal PB cells (n = 13,433) and TI cells (n = 12,239). Treg population (blue) was isolated and separated as TI (orange) versus PB Treg cells (gray). b tSNE projection with the highlighted expression of Treg markers, FOXP3 and IL2RA (CD25). c Differential gene expression analysis using the log-fold change expression versus the difference in the percentage of cells expressing the gene comparing TI versus PB Treg cells (Δ Percentage Difference). Genes labeled have log-fold change > 1, Δ Percentage Difference > 20% and adjusted P-value from Wilcoxon rank sum test <0.05. d Top eight upregulated genes by log-fold change in TI Treg cells with adjusted P-value <0.05. e Top eight downregulated genes by log-fold change in TI Treg cells with adjusted P-value <0.05. d, e Wilcoxon rank sum test with p-values adjusted using the Bonferroni method. f Comparison of differential genes in TI Treg cells in ccRCC (orange) and HCC (green) compared to PB Treg cells. Significant genes were defined as log-fold change >1 or <−1 with adjusted P-values <0.05. g Violin plots showing relative mRNA level of Treg markers in PB (gray) and TI Treg cells in ccRCC (top) and HCC (bottom).

