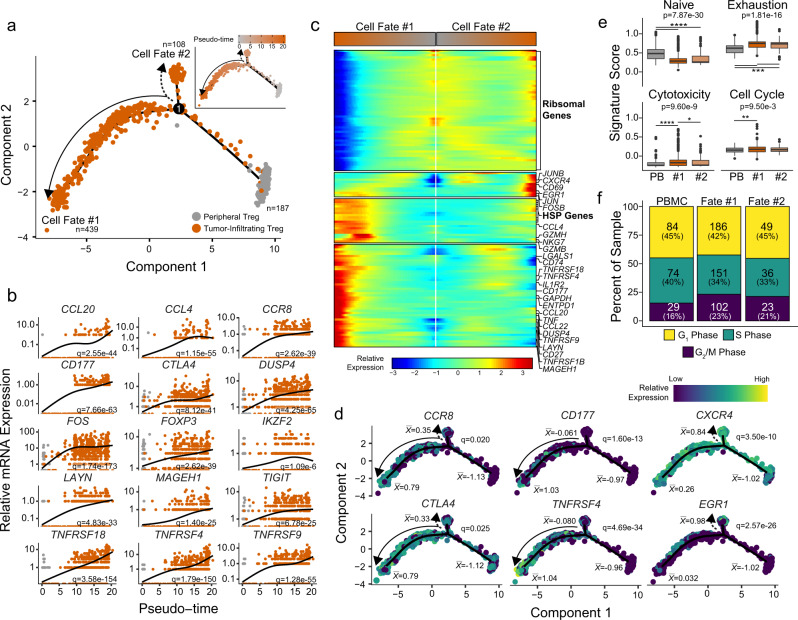
Fig. 2. Bifurcation in the transcriptional state of TI Treg cells reveals a more suppressive cell fate.
a Trajectory manifold of Treg cells from the ccRCC using the Monocle 2 algorithm. Solid and dotted lines represent distinct cell trajectories/fates defined by expression profiles. b Pseudotime projections of transcriptional changes in immune genes based on the manifold. The significance was determined based on differential testing relative to the site of origin which was also used to generate pseudotime and adjusted for multiple comparisons. c Expression heatmap of significant (q < 1e-6) genes based on branch expression analysis comparing the two TI cell fates. The genes in the heatmap were also used in the ordering of the pseudotime variable. d Cell trajectory projections of transcriptional changes in immune genes based on the manifold. Significance based on differential testing between the first and second cell fates of TI Treg cells. denotes the scaled mean mRNA levels at each pole of the manifold. e Gene set enrichment analysis of the poles of the trajectory manifold. Boxplots were drawn for values between 25th and 75th percentile with median value lines. Outlier values were graphed as individual points for values 1.5 times the interquartile range. P-values are based on one-way ANOVA with individual comparisons corrected for multiple hypothesis testing using the Tukey HSD method. f Results of the cell cycle regression analysis of single cells for each cell fate using the Seurat R package.

