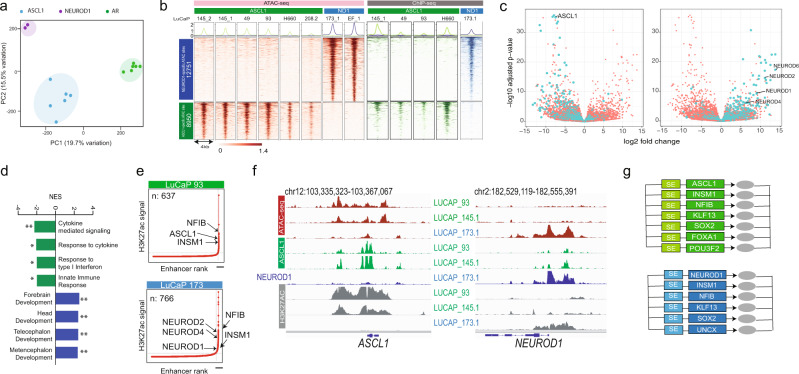
Fig. 2. NEPC shows tumor subtypes based on the differential expression of the transcription factors ASCL1 and NEUROD1.
a Principal component analysis of ATAC-seq data from NEPC and ADPC PDXs. Samples are color coded by the dominant TF expressed in that sample. b The left side of the heatmap (red) displays the differential ATAC-seq regions identified between NEPC subtypes. There are 12,751 NEUROD1-specific regions (top) and 8950 ASCL1-specific (bottom) ATAC sites. The right side of the heatmap shows the ChIP-seq data at the same sites for ASCL1 (green) and NEUROD1 (blue) for the indicated samples. c Association between differential ATAC-accessible sites and differential gene expression. Each volcano plot depicts RNA-seq log2-fold change (x-axis) and p-value adjusted for multiple hypothesis testing calculated by DESeq2 using a Wald’s test (y-axis). Each dot represents one gene: green indicates a differential ATAC peak is within 50 kB of the gene and orange indicates there is no such peak. Left: ASCL1-specific accessible regions and genes upregulated in ASCL1 subtype; (right) NEUROD1-specific accessible regions and genes upregulated in NEUROD1 subtype. d GSEA pathway analysis of genes enriched in the ASCL1 subtype (green) and the NEUROD1 subtype (blue) (**q-value < 0.001, *q-value < 0.05). e Signal distribution of H3K27ac marked enhancers from representative cases of the ASCL1 subtype (top) and NEUROD1 subtype (bottom). The bars in the lower right of each plot identify the subset of enhancers known as super-enhancers defined by the ROSE algorithm; 693 were identified in LuCaP 93 (ASCL1) and 766 in LuCaP 173.1 (NEUROD1). Super-enhancers nearby selected genes are indicated by the arrows. f Representative IGV tracks at the ASCL1 and NEUROD1 gene loci. ATAC-seq tracks are in red, ASCL1 ChIP-seq in green, NEUROD1 ChIP-seq in blue, and H3K27ac in gray. The loci are marked by subtype-specific super-enhancers with preferential binding of their respective TF. g Circuits of lineage transcription factors specific for the ASCL1 subtype (green) and NEUROD1 subtype (blue). Source data are provided as a Source Data file.

