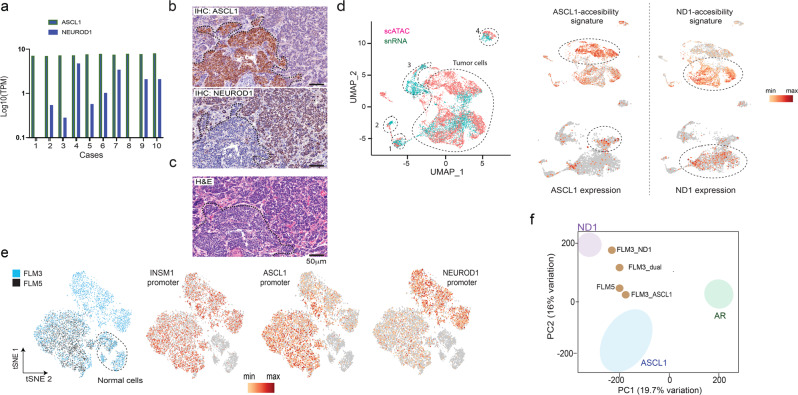
Fig. 3. Single-cell analysis reveals that NEPC subtypes co-exist in human metastasis and contribute to inter- and intra-tumoral heterogeneity.
a Plot of ASCL1 and NEUROD1 expression in NEPC tissues from a clinical cohort16. TPM: transcripts per million. b Representative immunostaining of FLM3 (ASCL1 staining in the top panel and NEUROD1 staining in the middle panel) showing intratumor heterogeneity. c Hematoxylin and eosin staining of the same field illustrates the distinct histologies for the two subpopulations. d Combined analysis of the scATAC-seq and snRNA-seq in FLM3 (left). Markers specific for normal cell populations enabled assignment of clusters: 1, vascular cells; 2, stromal cells; 3, hepatic cells; 4, monocytes. Accessibility at the top 30 differential ATAC-seq regions between ASCL1 and NEUROD1 subtypes identified by bulk analysis (top right). Analysis of ASCL1 and NEUROD1 expression in the snRNA-seq analysis (bottom right). This analysis matches cells with TF expression and the corresponding differential DNA accessibility for each subtype. e tSNE analysis of the combined FLM3 (blue) and FLM5 (black) scATAC-seq data (left). The other three plots show accessibility at INSM1 promoter (NE marker) and the differential accessibility at ASCL1 promoter and NEUROD1 promoter. f Projection of the aggregated scATAC-seq clusters for FLM3 and 5 (light brown dots) within the PCA space defined in Fig. 2a. Source data are provided as a Source Data file.

