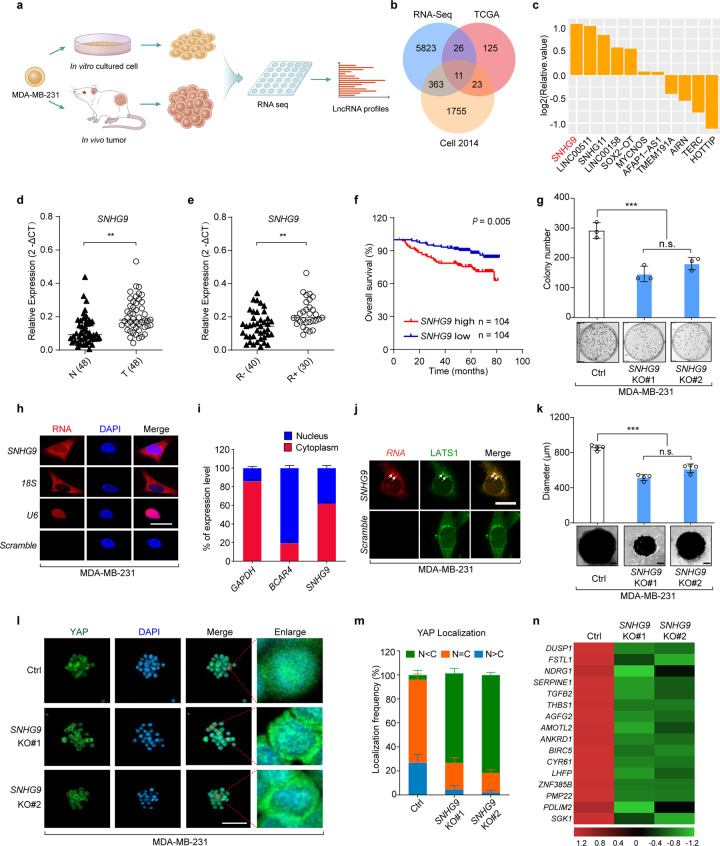
Fig. 1. The genome-wide analysis identified a lncRNA SNHG9 upregulated in breast tumors compared to cultured cancer cells.
a Schematic illustration showing the analysis of lncRNA profiles from subcutaneously xenografted tumors grown in vivo and tumor cells cultured in dishes in vitro. b A Venn Diagram showing upregulated lncRNAs within RNA-seq data, TCGA data (https://ibl.mdanderson.org/tanric/_design/basic/analysis.html) and our previous TNBC profiling data.1 c The list of 11 differentially expressed lncRNAs involved in 3D-cultured cells. d qRT-PCR detection of SNHG9 expression in breast cancer tissues and paired adjacent normal tissues (n = 48, Sun Yat-sen cohort). Horizontal black lines represent median values (**P < 0.01, Student’s t-test). e qRT-PCR detection of SNHG9 expression in breast cancer tissues from patients with (R+, n = 30) or without (R–, n = 40) recurrence (Sun Yat-sen cohorts). Horizontal black lines represent median values (**P < 0.01, Student’s t-test). f Kaplan–Meier survival analysis of SNHG9 expression in breast cancer patients (n = 208, Kaplan–Meier analysis with Gehan–Breslow test, P = 0.005). g The colony formation assay was performed on wild-type MDA-MB-231 cells and SNHG9 KO MDA-MB-231 cells. Error bars, SEM of three independent experiments (n.s., not significant; ***P < 0.001, Student’s t-test). h Subcellular localization of RNAs was detected by RNA FISH in MDA-MB-231 cells. Scale bar, 10 μm. i qRT-PCR detection of RNA expression in cytoplasmic and nuclear fractionations of MDA-MB-231 cells. Error bars, SEM of three independent experiments. j Spatial analysis of LATS1 and SNHG9 colocalization. Representative confocal images of LATS1 (green) and SNHG9 (red) in MDA-MB-231 cells are shown. Scale bar, 10 μm. k In vitro 3D culture and sphere formation assays were performed using wild-type MDA-MB-231 cells and SNHG9 KO MDA-MB-231 cells. The representative pictures were shown (bottom) and the diameter of the sphere was measured (top). Scale bar, 200 μm. Error bars, SEM of three independent experiments (n.s., not significant; ***P < 0.001, Student’s t-test). l, m SNHG9 induces YAP nuclear translocation. YAP subcellular localization was detected in the formed SNHG9 WT or SNHG9 KO tumor sphere (l). Scale bar, 50 μm. Cells from ten different fields were randomly selected and quantified for YAP localization (m). Error bars, SEM of three independent experiments. n qRT-PCR detection of YAP target gene expression. Heatmap shows significant expression changes induced by SNHG9 KO in MDA-MB-231 cells.

