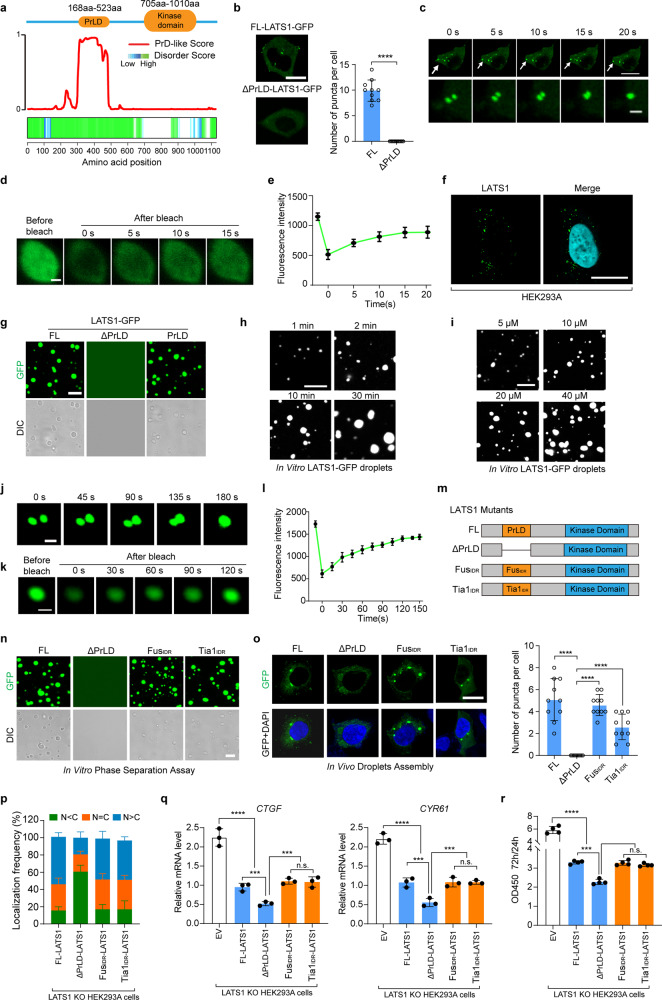
Fig. 4. LATS1 undergoes LLPS.
a PrLD prediction of LATS1. Top, schematic illustration of LATS1 showing domains. Bottom, predictions of PrLDs and disordered regions by Prion-like Amino Acid Composition (http://plaac.wi.mit.edu/), IUPred (https://iupred2a.elte.hu/) and D2P2 algorithms (http://d2p2.pro/). b HEK293A cells transfected with FL LATS1-GFP or ΔPrLD-LATS1-GFP (0.5 µg/well, 24-well) were analyzed by confocal microscopy. Representative pictures were shown (left panel), and the numbers of LATS1-GFP puncta per cell were counted in ten random fields (right panel). ****P < 0.0001, Student’s t-test. Scale bar, 10 μm. c Time-series fluorescence microscopy analysis of LATS1-GFP puncta. Bottom row shows zoom-in view of two fusing puncta. Scale bar, 10 μm (top) and 1 μm (bottom). d Representative micrographs of LATS1-GFP puncta before and after photobleaching. Scale bar, 0.2 μm. e Quantification of fluorescence intensity recovery in the bleached region of LATS1-GFP puncta. Error bars, SEM of three independent experiments. f Endogenous LATS1 puncta were detected using anti-LATS1 antibody in HEK293A cells permeabilized with 0.05% saponin. Scale bar, 10 μm. g Phase-separation assay of truncation mutants of LATS1 in vitro. The FL protein and PrLD fragment phase separated into liquid-like droplets, whereas ΔPrLD-LATS1-GFP failed. Scale bar, 2 μm. h Small droplets fused into larger ones over time in vitro. Scale bar, 5 μm. i LATS1-GFP fused into liquid droplets in a concentration-dependent manner in vitro. Scale bar, 5 μm. j LATS1-GFP droplets fused during the in vitro phase separation process. Scale bar, 1 μm. k The fluorescence intensity of LATS1-GFP droplets recovered after bleaching during FRAP assay. Time 0 indicates the photobleaching pulse. Scale bar, 1 μm. l Quantification of fluorescence intensity recovery in the bleached region of LATS1-GFP droplets. Error bars, SEM of three independent experiments. m Schematic illustration of LATS1 protein and its mutants. n Phase-separation assay of truncation mutants of LATS1 in vitro. FL-LATS1-GFP, FUSIDR-LATS1-GFP and Tia1IDR-LATS1-GFP phase separated into liquid-like droplets, whereas ΔPrLD-LATS1-GFP failed. Scale bar, 2 μm. o LATS1 KO HEK293A cells were transfected with FL-LATS1-GFP, ΔPrLD-LATS1-GFP, FUSIDR-LATS1-GFP and Tia1IDR-LATS1-GFP (0.3 µg/well, 24-well), then the cells were analyzed by confocal microscopy. The representative pictures were shown (left panel). The numbers of puncta per cell were counted in ten random fields (right panel). ****P < 0.0001, Student’s t-test. Scale bar, 10 μm. p LATS1 KO HEK293A cells were transfected with Flag-FL-LATS1 and its mutants (Flag-ΔPrLD-LATS1, Flag-FUSIDR-LATS1 and Flag-Tia1IDR-LATS1), respectively, and treated with PA (100 µM) for 1 h after serum starvation, then the subcellular localization of YAP was detected using immunofluorescence. Cells from five different fields were randomly selected and quantified for YAP localization. Error bars, SEM of three independent experiments. q, r LATS1 KO HEK293A cells were reconstituted with Flag-FL-LATS1, Flag-ΔPrLD-LATS1, Flag-FUSIDR-LATS1 and Flag-Tia1IDR-LATS1, respectively. qRT-PCR was used to detect the YAP target gene levels in indicated cells (q). The cell proliferation rates from 24 h to 72 h were assessed by OD density (450 nm) (r). Data are means ± SEM. n.s., not significant; ***P < 0.001; ****P < 0.0001, Student’s t-test.

