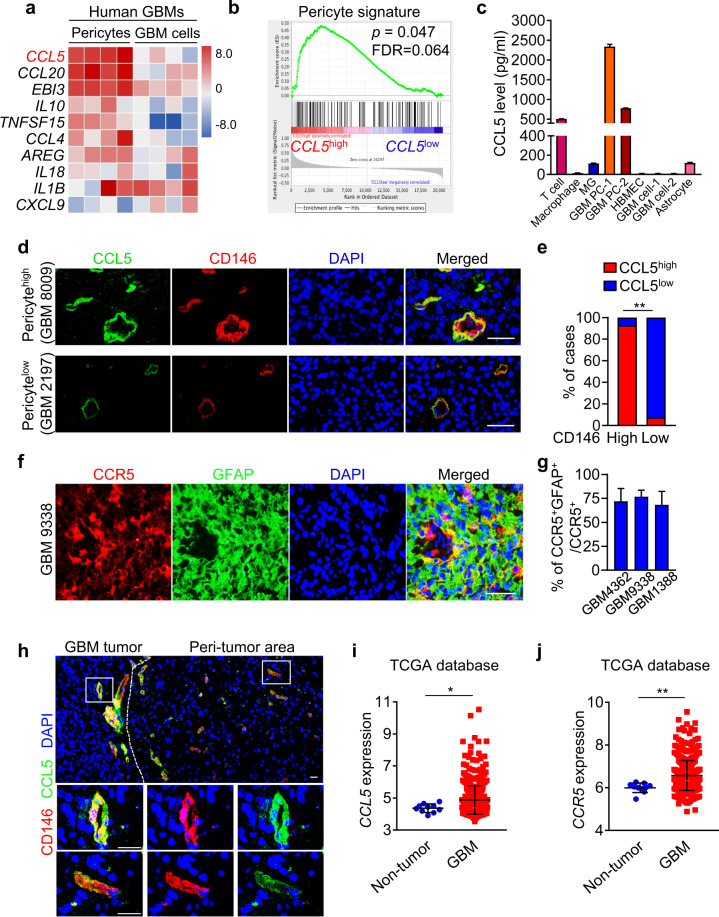
Fig. 4. CCL5-CCR5 paracrine axis represents a molecular link between pericytes and GBM cells.
a Top 10 upregulated cytokines in human pericytes relative to GBM cells identified by RNA-Seq and qRT-PCR analyses. b GSEA of pericyte score in human GBMs from the TCGA database (n = 152). c ELISA of CCL5 level in T cell, macrophage, microglia (MG), GBM pericytes (GBM PC-1, -2), HBMECs, GBM cells (GBM cell-1, -2) and astrocyte. Expression of CCL5 in CD3+ T cells was used as a positive control. d, e Immunofluorescence staining (d) and correlation (e) of CCL5 (green) and CD146 (red) expressions in human GBMs (n = 28). Scale bars, 50 μm. **P < 0.01. f, g Immunofluorescence staining of CCR5 (red) and GFAP (green) (f) and proportion of CCR5+/GFAP+ GBM cells in CCR5+ cells (g) in human GBMs. Scale bars, 50 μm. h Immunofluorescence staining of CD146 (red) and CCL5 (green) in GBM tumor and peri-tumor area of GBM. Scale bars, 25 μm. i, j Expression of CCL5 (i) and CCR5 (j) in human GBMs (n = 528) and non-tumor tissues (n = 10) from the TCGA database. *P < 0.05; **P < 0.01. Experiments were performed three times independently (a, c).

