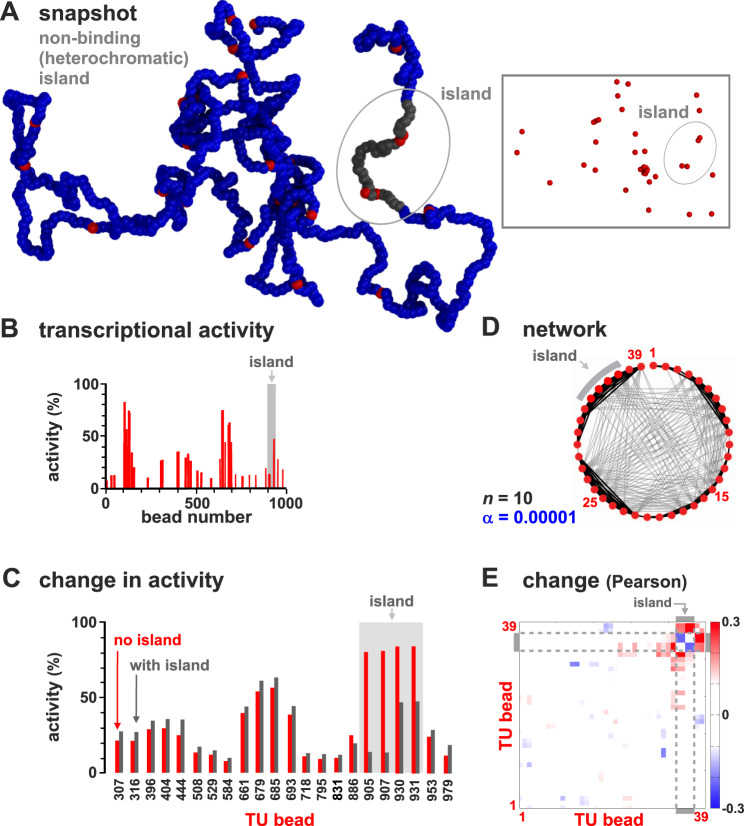
Fig. 6. Neighboring heterochromatin affects transcriptional activity.
Results from two sets of simulations (at least 800 runs for each condition) are compared; one set as Fig. 1, in the other beads around TU beads 905, 907, 930, and 931 (from bead 901 to 940) are non-binding (to represent embedding the TU beads in heterochromatin). A Snapshot with heterochromatic beads shown in gray (TFs not shown; inset—the same structure with only TUs). B Average transcriptional activity for each TU. C Comparison of average transcriptional activity with respect to wild type for the 22 TUs with significantly different values in the two sets (p ≃ 0.003; two-sided Student’s t-test). D Regulatory network inferred from the matrix of Pearson correlations between activities of TUs (as Fig. 3A). E Change in Pearson correlation between TUs due to heterochromatin.

