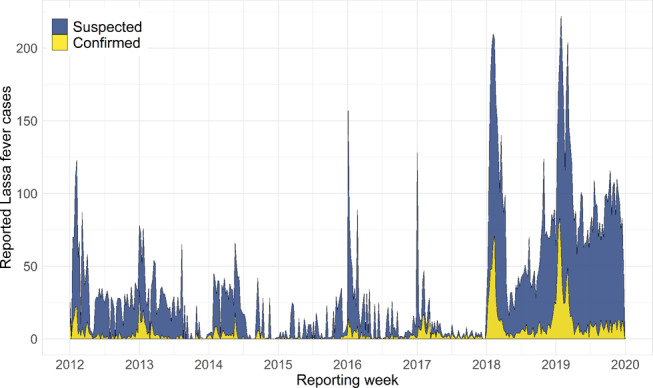
Fig. 1. Temporal trends in country-wide Lassa fever case reporting from 2012 to 2019.

Polygon height shows the weekly total cases reported across Nigeria, with colour denoting the proportion of cases that were laboratory-confirmed (yellow) or suspected (blue). The full case time series was compiled from two reporting regimes at the Nigeria Centre for Disease Control: Weekly Epidemiological Reports 2012 to 2016, and Lassa Fever Technical Working Group Situation Reports 2017 to 2019 (with case reports followed-up to ensure more accurate counts; datasets shown separately in Supplementary Fig. 1). A full description of case definitions and reporting protocols is provided in Methods.
