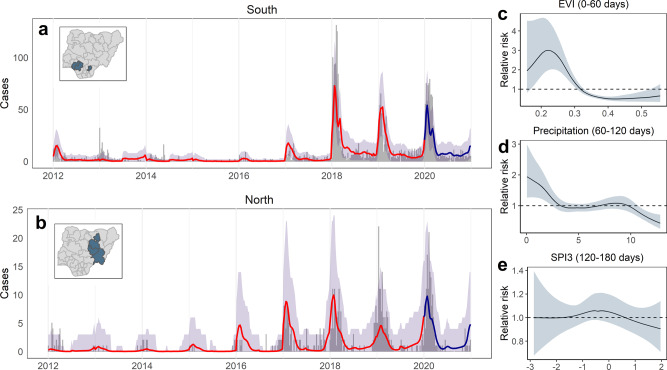
Fig. 4. Modelled temporal dynamics and drivers of confirmed Lassa fever cases in the south and north Nigeria.
Case time series show observed and out-of-sample (OOS) predicted weekly case counts from a climate-driven model (n = 2820), summed across all states in the southern (a; Edo and Ondo states) and northern (b; Bauchi, Plateau and Taraba states) endemic areas to visualise regional differences. Time series graphs (a, b) show observed counts from 2012 to 2019 (grey bars), OOS posterior median predicted cases (red line) and OOS 95% (grey shading) posterior predictive intervals (both calculated from 2500 samples drawn from the joint posterior). OOS predictions were made while holding out sequential 6-month windows across the full time series at state-level (Supplementary Fig. 8). The dark blue line and shaded area in 2020 shows prospective predicted cases (median and 95% predictive interval) compared to observed cases from this period, which were not included in model fitting (Methods). Inset maps show states included in the models. Panels show nonlinear fitted effects of Enhanced Vegetation Index (EVI) (c), mean daily precipitation (d), and 3-month Standardised Precipitation Index (SPI3; e) on relative risk, showing posterior mean and 95% credible interval. The marginal contributions of yearly, seasonal and climatic effects are visualised separately in Supplementary Fig. 7.

