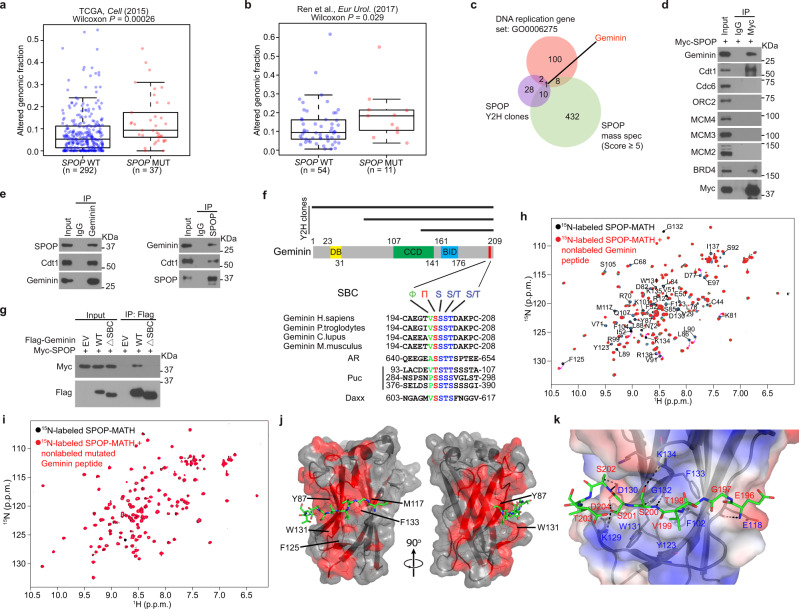
Fig. 1. Identification of the DNA replication factor Geminin as a SPOP-binding protein.
a, b Analysis of altered genomic fraction in prostate cancer patient specimens with wild-type (WT) (blue dots) or mutant (MUT) (red dots) SPOP in The Cancer Genome Atlas (TCGA) dataset28 (a) and an independent prostate cancer whole-genome sequencing dataset44 (b). Data were generated using the cBioPortal (https://www.cbioportal.org/) online tool. Boxplots show median, interquartile ranges, and all data points. P values were calculated using one-sided Wilcoxon rank-sum test. c Venn diagram showing the overlap of yeast two-hybrid screen data from Fudan University (Shanghai), mass spectrometry-based SPOP interactome from Mayo Clinic, and the DNA replication gene set. d Co-IP analysis of DNA replication-related proteins in 293T cells transfected with Myc-SPOP. e Co-IP analysis of endogenous proteins in PC-3 cells using the indicated antibodies. f A Geminin domain structure diagram showing a putative evolutionally conserved SBC motif (in red) located at the C-terminal end of Geminin (middle and bottom). All three Y2H clone clusters contain this motif (top). g Co-IP analysis of indicated proteins in 293T cells transiently transfected with Myc-SPOP-WT or ΔBTB mutant. h, i Perturbations in the 1H-15N HSQC NMR spectra of 15N-labeled SPOP MATH upon titration with unlabeled WT (h) or mutated (i) Geminin peptide (amino acids 195–209). j Crystal structure of SPOP-MATH (surface representation) in complex with the Geminin peptide (amino acids 195–209) in stick representation. Peptide residues 196–204 were modeled in the electron density. The red surface corresponds to SPOP residues for which chemical shift perturbations were detected in the 1H-15N HSQC NMR spectrum of 15N-labeled SPOP MATH titrated with unlabeled Geminin peptide. Selected SPOP residues frequently mutated in cancer patients are labeled. k Representation of Geminin peptide and SPOP residues at the binding interface. Putative intermolecular hydrogen bonds are shown in black dashes. The potential electrostatic surface of SPOP is shown in blue and red for positive and negative charges, respectively. Source data are provided in this paper or Mendeley database (10.17632/8n7xt5rkhc.1). Similar results for (d), (e), (g) panels were obtained in two independent experiments.

