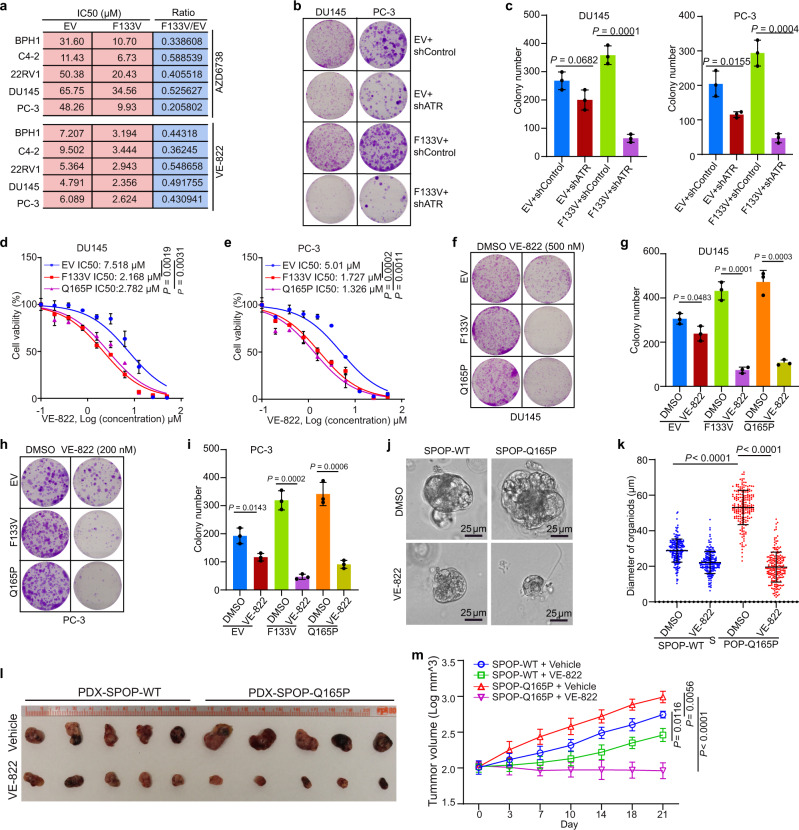
Fig. 6. SPOP mutant cells are sensitive to ATR pathway inhibition.
a IC50 analysis of two ATR inhibitors in five prostate cell lines expressing EV or SPOP-F133V mutant. b, c Colony formation assays were performed in DU145 and PC-3 cell lines infected with lentivirus expressing control or ATR-specific shRNA or empty vector (EV) or SPOP mutant F133V. The number of colonies was counted. Representative colonies are shown in (b) with quantification data shown in (c). Data are presented as the mean ± SD of three independent experiments. Two-tailed unpaired Student’s t-test. d, e Dose-response survival curves of EV, SPOP F133V, and SPOP Q165P cells exposed to increasing concentrations of VE-822 in DU145 (d) and PC-3 (e) cells. Data are shown as the mean ± SD of three independent experiments (n = 3 replicates/group). Two-tailed unpaired Student’s t-test. f–i Colony formation assay was performed in DU145 (f, g) and PC-3 (h, i) cell lines treated with DMSO or VE-822. The number of colonies was counted. Representative colonies are shown in (f, g) with quantification data shown in (h, i). Data are shown as the mean ± SD of three independent experiments (n = 3). Two-tailed unpaired Student’s t-test. j, k SPOP WT and Q165P organoid lines derived from Q165P PDX tumors were cultured for 5 days, followed by treatment with DMSO or VE-822 (200 nM) for five more days. The representative images of organoids after the treatment are shown in (j) and the quantified data of the organoid diameter are shown in (k). All data are shown as mean ± SD (n = 200). The P value was calculated using unpaired two-tailed Student’s t-test. l, m SPOP-WT or SPOP Q165P PDX tumors were transplanted subcutaneously into SCID mice and treated with VE-822 (60 mg/kg, 5 times weekly by oral gavage) or vehicle. Mice were treated for 3 weeks and then sacrificed. Xenograft tumors were isolated and are shown in (l). Log of quantified volumes of the tumors from (l) (n = 5) are shown in (m). All data are shown as mean ± SD. The P value was calculated by two-way ANOVA analysis. Source data are provided in this paper.

