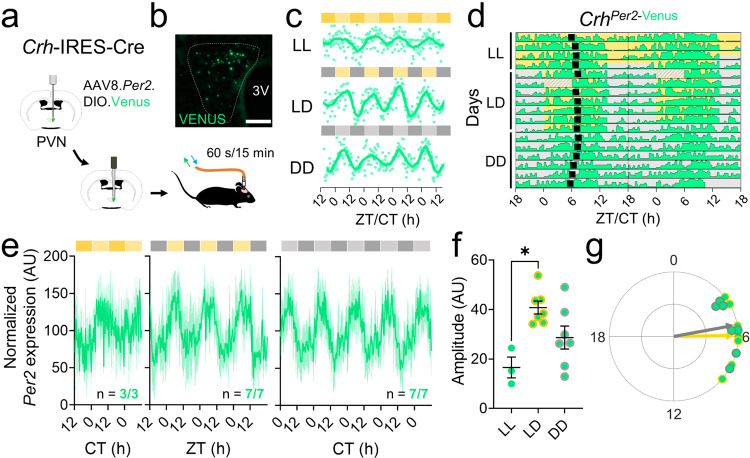
Fig. 1. PVNCRH neurons exhibit daily rhythms in clock gene expression that peak at midday.
a Schematic of in vivo fiber photometry recording of Per2 expression from targeted cells in the hypothalamic paraventricular nucleus (PVN) of CrhCre/+ mice. b Representative (n = 4 replicates) PVN (dashed line) image depicting Cre-dependent Venus expression (light green). 3 V, third ventricle. Scale bar = 100 µm. c Representative in vivo Per2-Venus fluorescence from PVNCRH neurons averaged over 60 s every 15 min (light green dots) for 4 days from mice housed in constant light (LL), a 12 h:12 h light:dark cycle (LD), or constant darkness (DD). Data were smoothed with a 4 h Savitzky–Golay filter (light green line). ZT zeitgeber time; CT circadian time. d Representative double-plotted actogram of Per2-Venus fluorescence (light green) recorded from PVNCRH neurons in a mouse over 17 days in LL, LD, and DD. Black squares depict daily Per2 acrophases. Recording was interrupted for part of day 6 (hatched rectangle). e Normalized levels of Per2 expression from PVNCRH neurons in mice recorded in LL (dark yellow and yellow bars; n = 3/3 mice rhythmic, JTK cycle, p < 0.020 or less, see Supplementary Table 1 for p-values of individual mice), LD (gray and yellow bars; n = 7/7 mice rhythmic, JTK cycle, p < 0.001 for all mice), and DD (gray and light gray bars; n = 7/7 mice rhythmic, JTK cycle, p < 0.001 for all mice). Light green lines and shading depict mean ± SEM. f The peak-to-trough amplitudes of PVNCRH Per2 rhythms in LL, LD, and DD. n = 3, 7, 7 mice. Brown–Forsythe ANOVA with post-hoc Dunnett’s multiple comparison’s test, p = 0.007. Lines depict mean ± SEM. g Rayleigh plots of Per2 expression in PVNCRH neurons from mice housed in LD (light green dots with yellow outlines; peak time ZT 5.9, Rayleigh test, p = 0.001) and in DD (gray outlines; peak time CT 5.3, Rayleigh test, p = 0.001). In this and other Rayleigh plots, arrows point to the mean time of day when the rhythm peaked, and the length of the arrow indicates variability in the data ranging from 0 (peaked at random times) to 1 (all recordings peaked at the same time). Source data are provided as a Source Data file.

