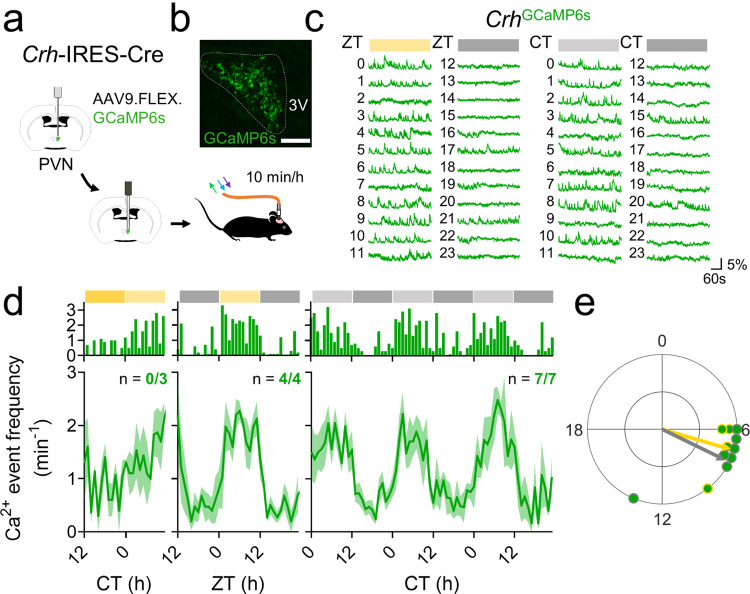
Fig. 2. PVNCRH neurons exhibit daily rhythms in calcium activity that peak at mid-afternoon.
a Schematic for in vivo fiber photometry recording of calcium activity in the PVN of CrhCre/+ mice. b Representative (n = 4 replicates) PVN (dashed line) image depicting Cre-dependent GCaMP6s expression (green). 3V third ventricle. Scale bar = 100 µm. c Representative GCaMP6s traces (in ΔF/F) from PVNCRH neurons recorded hourly from a mouse in LD (12 h:12 h light:dark cycle; left plot, where yellow = light phase) and another in DD (constant darkness; right plot, where light gray = subjective day). ZT zeitgeber time; CT circadian time. d Calcium event frequency rhythms from PVNCRH neurons in mice recorded in LL (constant light; n = 0/3 mice rhythmic, JTK cycle, p > 0.050 for all mice, see Supplementary Table 1 for p-values of individual mice), LD (n = 4/4 mice rhythmic, JTK cycle, p < 0.001 for all mice) and in DD (n = 7/7 mice rhythmic, JTK cycle, p < 0.030 or less, see Supplementary Table 1 for p-values of individual mice). Top, event frequency rhythms from a representative mouse; bottom, event frequency rhythms averaged from multiple mice. Green lines and shading depict mean ± SEM. e Rayleigh plots of calcium event frequency rhythms in PVNCRH neurons from mice housed in LD (green dots with yellow outlines; peak time ZT 7.1, p = 0.019) and in DD (gray outlines; peak time CT 7.7, Rayleigh test, p = 0.003). Source data are provided as a Source Data file.

