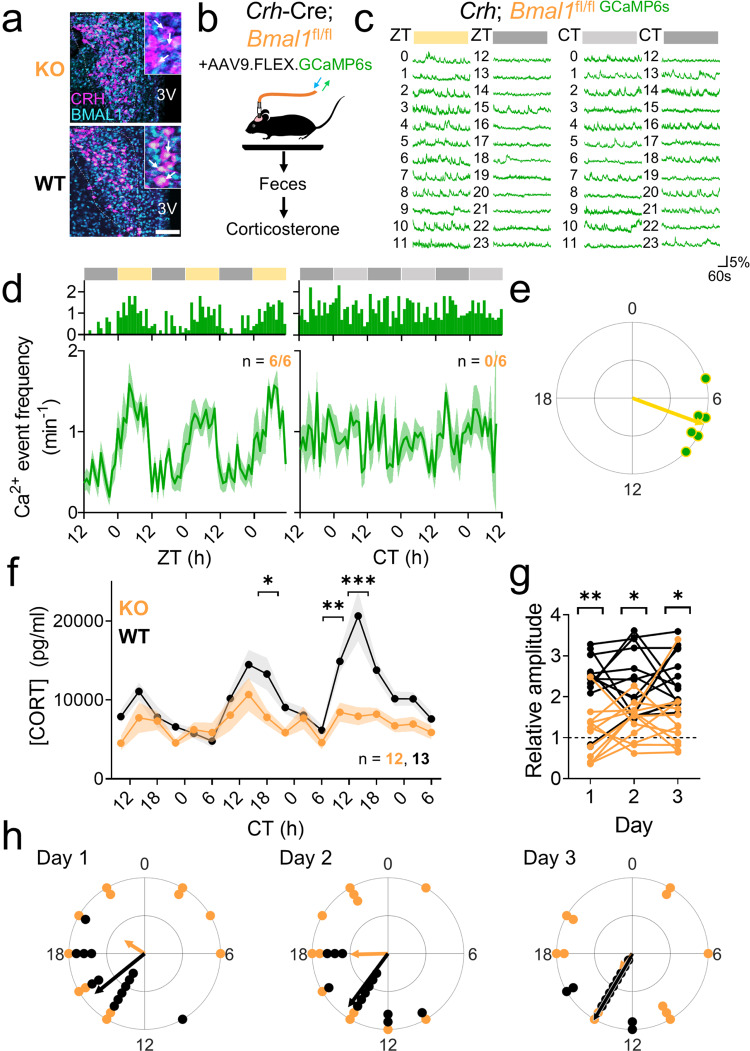
Fig. 3. Ablation of BMAL1 in CRH neurons blunts and desynchronizes circadian rhythms in calcium activity and corticosterone.
a Representative (n = 4 replicates) PVN (dashed line) immunohistochemistry images from CrhCre/Cre; Bmal1fl/fl (KO, top) and CrhCre/+; Bmal1fl/fl (WT, bottom) mice depicting CRH (magenta) and BMAL1 (cyan) expression. 3V third ventricle. Scale bar = 100 µm. Inset, higher magnification image. b Schematic of fiber photometry and fecal corticosterone collection. c Representative GCaMP6s traces (in ΔF/F) from PVNCRH neurons recorded hourly from a KO mouse in LD (12 h:12 h light:dark cycle; left plot, where yellow = light phase) and in DD (constant darkness; right plot, where light gray = subjective day). ZT zeitgeber time, CT circadian time. d Calcium event frequency rhythms from PVNCRH neurons in KO mice recorded in LD (n = 6/6 mice rhythmic, JTK cycle, p < 0.040 or less, see Supplementary Table 1 for p-values of individual mice) and in DD (n = 0/6 mice rhythmic, JTK cycle, p > 0.050 for all mice, see Supplementary Table 1 for p-values of individual mice). Top, event frequency rhythms from a representative mouse; bottom, event frequency rhythms averaged from multiple mice. Green lines and shading depict mean ± SEM. e Rayleigh plots of calcium event frequency rhythms in PVNCRH neurons from KO mice housed in LD (green dots with yellow outlines; peak time ZT 7.3, Rayleigh test, p = 0.001; KO vs. WT peak time Watson–Williams test, p = 0.796). Arrhythmic recordings from KO mice housed in DD are not depicted. f Corticosterone rhythms over 3 days in WT (black, n = 13) and KO mice (orange, n = 12). Lines and shading depict mean ± SEM. Mixed-effects model with post-hoc Sidak’s multiple comparisons test, *p = 0.041, **p = 0.009, ***p < 0.001. g The relative amplitude of the corticosterone rhythm (the ratio of the average level at CT 10-18 divided by the average at CT 22-6) in WT (black) and KO (orange) mice on each day of collection. Two-way repeated-measures ANOVA with post-hoc Sidak’s multiple comparisons test, *p = 0.002, ***p < 0.001. h Rayleigh plots of corticosterone rhythms in WT (black dots, peak times Days 1–3 CTs 15.3, 14.4, 14.2, Rayleigh test, p < 0.001 on each day) and KO (orange, no significant clustering on any day, Rayleigh test, p = 0.427, 0.101, 0.720 on days 1, 2, and 3, respectively) mice on each day of collection. Phases differed significantly between genotypes (two-way circular ANOVA, p < 0.001). Source data are provided as a Source Data file.

