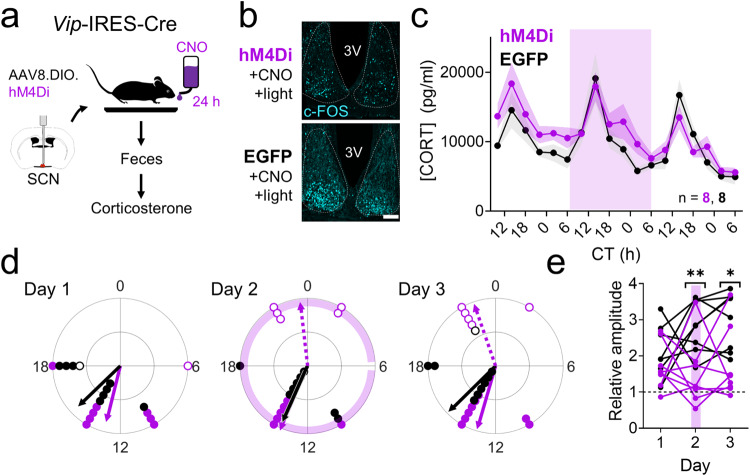
Fig. 5. Silencing of SCNVIP neurons augments circadian rhythms in corticosterone during the early morning.
a Schematic for fecal corticosterone collection and chemogenetic SCN inhibition. b c-FOS immunoreactivity (n = 4 replicates, cyan) after clozapine-N-oxide (CNO) administration 30 min before a 15 min light pulse at CT (circadian time) 12 in VipCre/+ + hM4Di (hM4Di, top) and VipCre/+ + EGFP (EGFP, bottom) mice. 3V third ventricle. Scale bar = 100 µm. c Corticosterone rhythms over three days in EGFP (black, n = 8) and hM4Di mice (purple, n = 8). Lines and shading depict mean ± SEM. Purple shading, time of ad libitum exposure to CNO in the drinking water. Mixed-effects model, p = 0.066. d Rayleigh plots of the first (filled dots, solid lines) and second (open dots, dashed lines) corticosterone peaks in EGFP (black, first peak times days 1–3 CTs 15.0, 13.5, 14.9, Rayleigh test, p = 0.004, 0.002, <0.001 on days 1, 2, and 3, respectively; no significant second peak times) and hM4Di (purple, first peak times days 1–3 CTs 12.9, 13.5, 13.1, Rayleigh test, p = 0.004, <0.001, <0.001 on days 1, 2, and 3, respectively; second peak times days 2–3 CTs 23.6, 22.7, Rayleigh test, p = 0.013, 0.007 on days 2 and 3, respectively) mice on each day of collection. e The relative amplitude of the corticosterone rhythm (the ratio of the peak level at CT 10-18 divided by the peak level at CT 22-6) in EGFP (black) and hM4Di (purple) mice on each day of collection. Purple line depicts the day of ad libitum exposure to CNO in the drinking water for 24 h. Two-way repeated-measures ANOVA with post-hoc Sidak’s multiple comparisons test, *p = 0.010, **p = 0.006. Source data are provided as a Source Data file.

