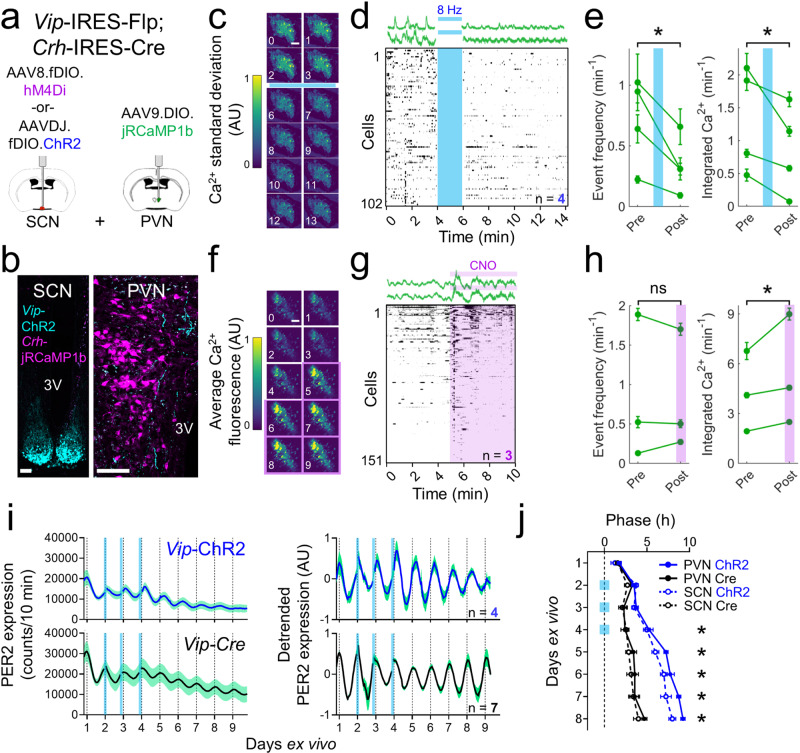
Fig. 6. SCNVIP neurons inhibit PVNCRH neuron activity and shift PVN clock gene rhythms.
a Schematic for simultaneous SCNVIP neuron manipulation and PVNCRH neuron calcium imaging. b Representative (n = 4 replicates) images from a VipFlp/+; CrhCre/+ mouse showing concurrent Flp-dependent ChR2 (cyan) and Cre-dependent jRCaMP1b (magenta) expression. 3V third ventricle. Scale bar = 100 µm. c The change in calcium fluorescence over each minute of recording in an individual ex vivo PVN slice before and after stimulation (blue bar; 470 nm, 8 Hz, 10 ms pulse width, 2 min duration) around subjective dusk (circadian time (CT) 11-12). Warmer colors represent a greater change in calcium fluorescence. d Top, representative calcium traces (in ΔF/F) from two PVNCRH neurons recorded before and after stimulation. Bottom, raster plot depicting PVNCRH neuron calcium activity in individual neurons before and after SCNVIP stimulation (n = 102 cells, 4 slices). Raster plot was thresholded to show the upper 50% ΔF/F of each trace for visualization. e Calcium event frequency and integrated calcium levels in PVNCRH neurons in each PVN slice (green lines, mean ± SEM) before and after SCNVIP stimulation (blue line). Two-way repeated-measures ANOVA, p < 0.001 for event frequency and integrated calcium levels. f The average calcium fluorescence over each minute of recording in an individual ex vivo PVN slice before and during clozapine-N-oxide (CNO) treatment (purple shading, 1 µl of 10 µM CNO) around subjective afternoon (CT 6-8). Warmer colors represent increased calcium fluorescence. g Top, representative calcium traces from two PVNCRH neurons recorded before and during CNO treatment. Bottom, raster plot depicting PVNCRH neuron calcium activity in individual neurons before and after CNO treatment (n = 151 cells, 3 slices). h Calcium event frequency and integrated calcium levels in PVNCRH neurons in each PVN slice (green lines, mean ± SEM) before and during SCNVIP inhibition (purple shading). Two-way repeated-measures ANOVA, p < 0.001 for integrated calcium levels, p = 0.345 for event frequency. i (Left) Raw and (right) detrended PER2::LUC bioluminescence traces from the PVN of VipCre/+; PER2LUC/+ (black, n = 6) and VipCre/+; Ai32fl/+; PER2LUC/+ (blue, n = 4) mice stimulated for 1 h per day for 3 d (blue bars, 8 Hz, 470 nm, 10 ms). j Peak times of PER2::LUC bioluminescence in PVN (solid circles and lines) and SCN (open circles, dashed lines) slices from Vip-ChR2 (blue) and Vip-Cre (black) mice before, during, and after daily optogenetic stimulation (blue squares). Peak times between ChR2 and control PVN were significantly different on days 4–8 (Two-way circular ANOVA, p < 0.001 on each day). Source data are provided as a Source Data file.

