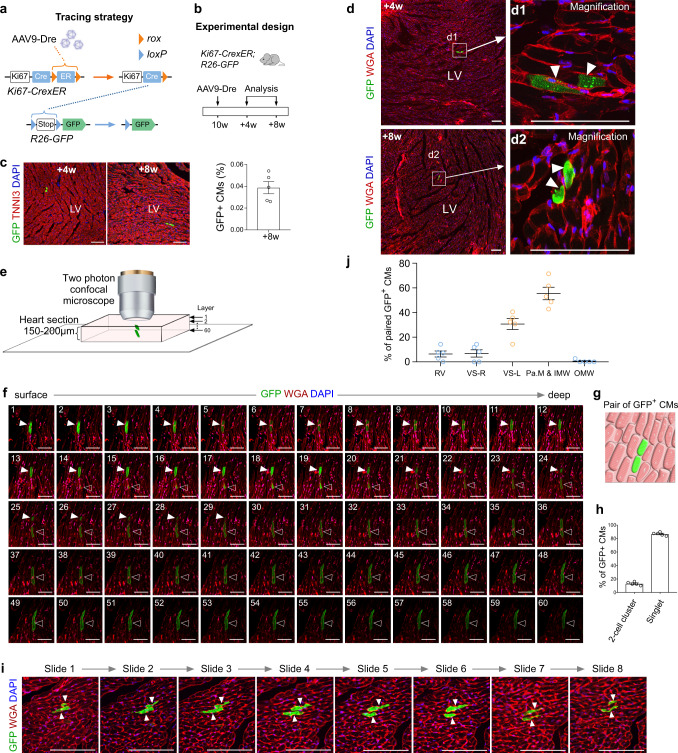
Fig. 3. A subset of Ki67+ cardiomyocytes labeled by ProTracer have undergone cytokinesis.
a Schematic showing strategy of labeling Ki67+ cardiomyocytes by AAV9-Dre injection into Ki67-CrexER;R26-GFP mice. b Schematic showing the experimental design. A low dosage of AAV9-Dre was injected into mice. c Immunostaining for GFP and TNNI3 on heart sections reveals sparse labeling of cardiomyocytes (CMs) and quantification of the percentage of CMs expressing GFP. d Immunostaining for GFP and WGA on 10 µm heart sections reveals sparsely labeled CMs (< 0.1%) on heart sections collected at 4 or 8 weeks after AAV injection. Arrowheads, sparse pair of GFP+ CMs. e, f Confocal microscopy of thick heart sections (150–200 µm) reveals two neighboring GFP+ CMs (arrowheads). Each stacked image is composed of ~ 60 layers of scanned signals of heart sections stained with GFP and WGA. g Cartoon image showing a pair of two neighboring GFP+ CMs. h Quantification of the percentage of GFP+ CMs contributed from 2-cell cluster or single-cell cluster (singlet). Data are the mean ± SEM; n = 5. i Immunostaining for GFP and WGA on consecutive tissue sections (serial tissue slide 1 to slide 8, each 10 µm) revealed a pair of neighboring CMs (arrowheads). j Quantification of the distribution of GFP+ 2-cell clusters in different regions of the ventricles. Data are the mean ± s.e.m.; n = 5. Scale bars: 100 µm. Each image is representative of five individual biological samples.

