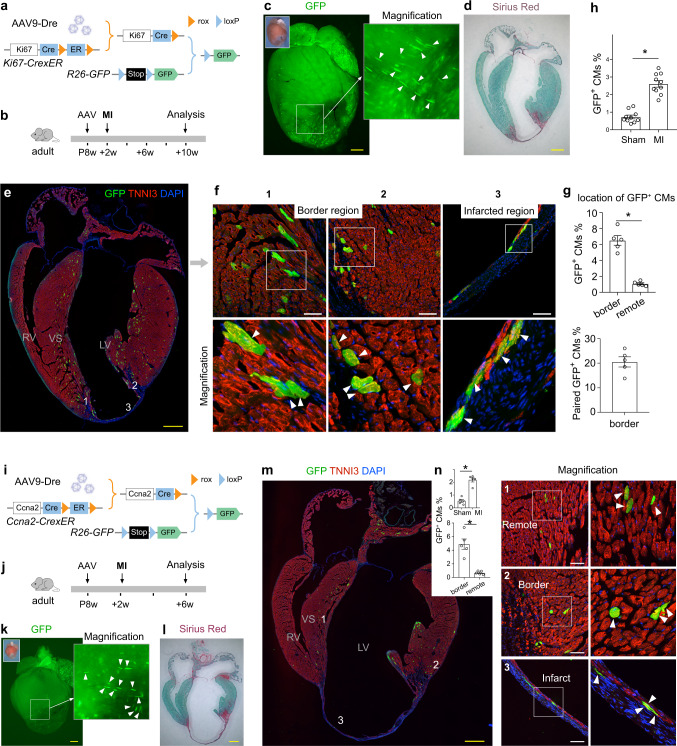
Fig. 7. Cardiomyocyte cell-cycle activity detected by ProTracer after myocardial infarction.
a Schematic showing Ki67-based ProTracer system. b Schematic showing experimental design. c Whole-mount GFP fluorescence of MI hearts. Magnified image shows GFP+ cardiomyocytes (arrowheads). d Sirius Red staining on MI heart sections. e, f Immunostaining for GFP and TNNI3 on MI heart sections. Regions 1, 2, 3 are magnified on the right panels. Arrowheads, GFP+ cardiomyocytes. g Quantification of GFP+ CM percentage in different regions of the hearts and the percentage of paired GFP+ cardiomyocytes in GFP+ cardiomyocytes adjacent the infarct. Data are mean ± s.e.m.; n = 5; *P < 0.0001. h Quantification of GFP+ CM percentage in Sham or MI hearts. Data are mean ± s.e.m.; n = 10; *P < 0.0001. i Schematic showing CCn2a-based ProTracer system. j Schematic showing experimental design. k Whole-mount GFP fluorescence of MI hearts. Magnified image shows GFP+ cardiomyocytes (arrowheads). l Sirius Red staining on MI heart sections. m Immunostaining for GFP and TNNI3 on MI heart sections. Regions 1, 2, 3 are magnified on the right panels. Arrowheads, GFP+ cardiomyocytes. n Quantification of GFP+ CM percentage in Sham or MI hearts and the location of GFP+ cardiomyocytes in different regions of the MI hearts. Data are mean ± s.e.m.; n = 5; *P < 0.0001, *P = 0.0006; Data were analysed by two-tailed unpaired t-test (g, h, n). Scale bars: yellow, 1 mm; white, 100 µm. Each image is representative of five individual biological samples.

