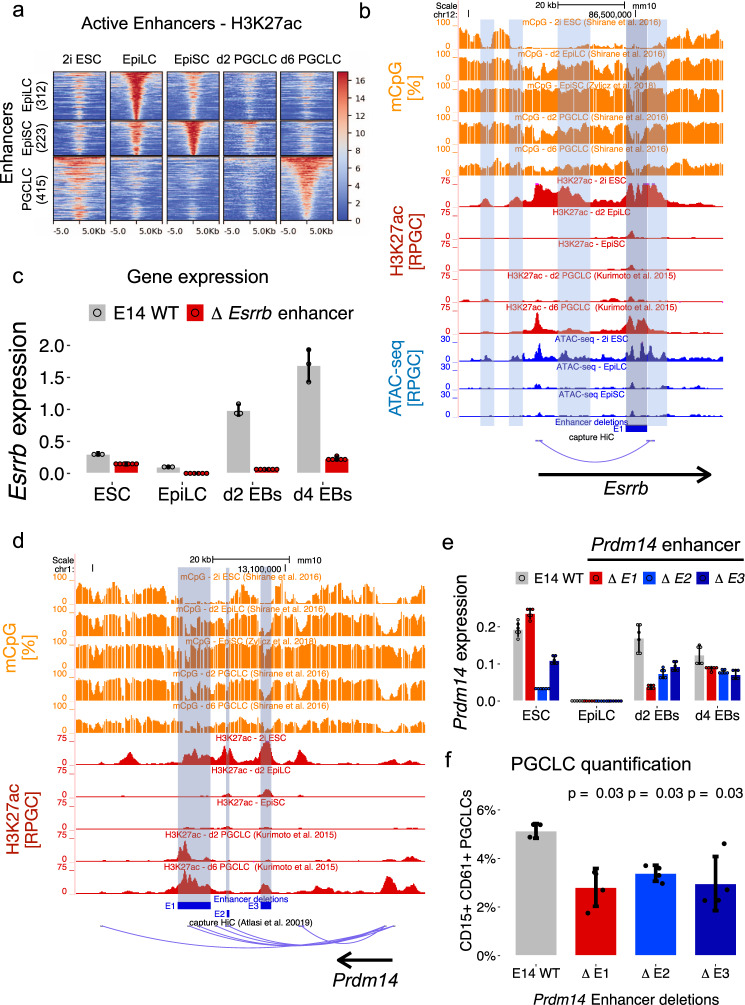
Fig. 2. Identification and functional assessment of PGCLC enhancers.
a H3K27ac dynamics for EpiLC, EpiSC, and PGCLC enhancers during PGCLC differentiation (see Methods for the definition of enhancer sets). Enhancers within each set were ordered according to the H3K27ac levels in the corresponding cell type. RPGC: reads per genomic content. b ATAC-seq, H3K27ac, and CpG methylation dynamics during PGCLC differentiation for the Esrrb locus. A PGCLC enhancer physically linked to the Esrrb according to capture Hi-C data47 is highlighted in gray. H3K27ac peaks found only in ESC and representing putative ESC-specific enhancers are highlighted in light blue. The blue rectangle denotes the generated enhancer deletion. c Esrrb expression levels were measured by RT-qPCR in d4 EB differentiated from WT ESC and the two ESC clonal lines with the Esrrb enhancer deletion shown in (b). The expression values were normalized to two housekeeping genes (Eef1a1 and Hprt). The bar plots show the mean expression ± SD from 6 measurements (two clonal lines × three technical replicates shown as circles). d H3K27ac and CpG methylation dynamics during PGCLC differentiation for three PGCLC enhancers (E1–E3) found within the Prdm14 locus. The blue rectangles denote the generated enhancer deletions. The E1-E2 enhancers are physically linked to Prdm14 in ESC according to capture Hi-C data47. RPGC: reads per genomic content. e Prdm14 expression levels were measured by RT-qPCR in d4 EB differentiated from WT ESC and ESC with the indicated Prdm14 enhancer deletions (two clonal lines for each deletion). The expression values were normalized to two housekeeping genes (Eef1a1 and Hprt). The bar plots show the mean expression ± SD from 6 measurements (two clonal lines x three technical replicates shown as circles). f WT ESC and ESC lines with the indicated Prdm14 enhancer deletions were differentiated into PGCLC. PGCLC were measured as CD15+CD61+ cells within d4 EB. Each PGCLC quantification is shown as means ± SD from biological duplicates and two different clonal lines for each enhancer deletion (n = 2 × 2). The p-values were calculated using two-sided Wilcoxon tests comparing cells with enhancer deletions to WT cells.

