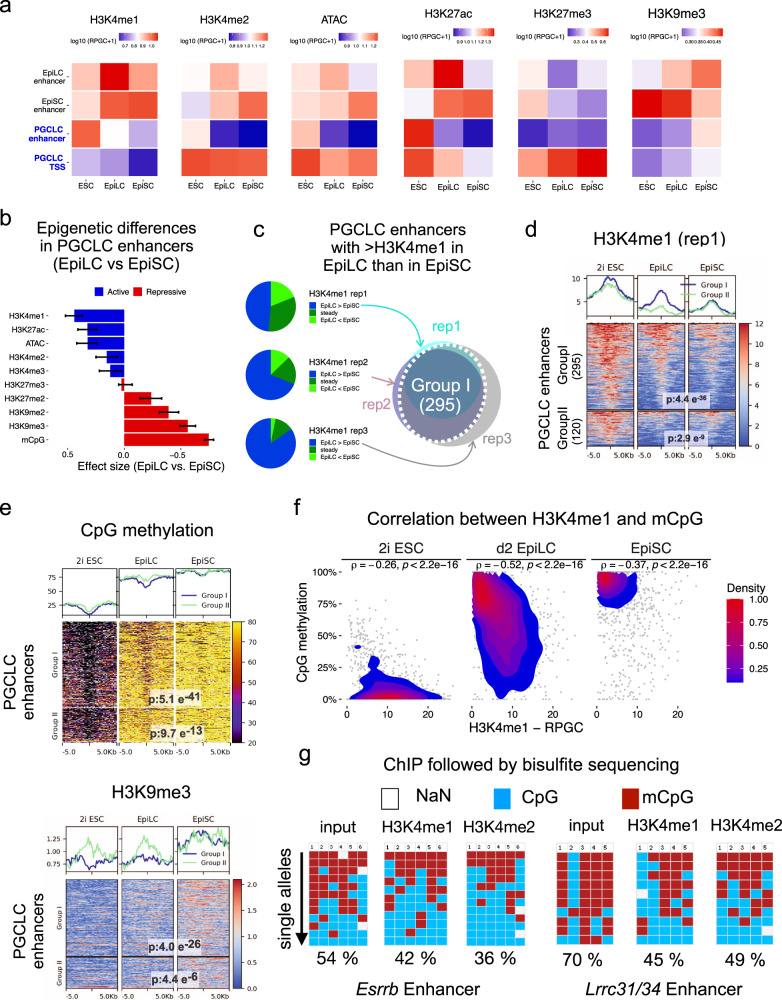
Fig. 3. Chromatin features of PGCLC enhancers in ESC, EpiLC, and EpiSC.
a Chromatin marks were measured in ESC, EpiLC, and EpiSC for the indicated enhancers and the TSS of the PGCLC genes. Quantifications were performed by measuring average signals within 1 kb of the enhancers or TSS (RPGC: Reads per genomic content). b The magnitude of the differences in chromatin marks between EpiLC and EpiSC within PGCLC enhancers (n = 415) was determined as the effect sizes from paired two-sided Wilcoxon tests. The bar plots show the effect size and the error bars represent the confidence intervals (0.95). c Three H3K4me1 ChIP-seq replicates were generated in EpiLC and EpiSC, respectively. For each replicate, the average H3K4me1 signal within 1 kb of each PGCLC enhancer was calculated. PGCLC enhancers showing EpiLC/EpiSC ratios >1.2-fold were assigned to the ‘EpiLC>EpiSC’ category. PGCLC enhancers assigned to the ‘EpiLC>EpiSC’ category in at least two replicates were defined as Group I. All other enhancers were assigned to Group II. d H3K4me1 levels (first replicate) for Group I and II PGCLC enhancers in EpiLC and EpiSC. P-values were calculated using paired two-sided Wilcoxon tests. e H3K9me3 and CpG methylation levels for Group I and II PGCLC enhancers in EpiLC and EpiSC. P-values were calculated using paired two-sided Wilcoxon tests. The scales for H3K9me3 and CpG methylation data are shown as RPGC and % of methylated CpGs, respectively. f Correlation plots between CpG methylation and H3K4me1 at Group I PGCLC enhancers. For each enhancer, the average CpG methylation and H3K4me1 levels (first ChIP-seq replicate) were calculated for two 500 bp bins up- and downstream of each enhancer, and spearman correlations (ρ) were determined. g Bisulfite sequencing analysis of the PGCLC enhancers associated with Esrrb and Lrrc31/34 using as templates input DNA, H3K4me1 ChIP DNA, and H3K4me2 ChIP DNA generated in EpiLC. The columns correspond to individual CpGs within each enhancer that are unmethylated (blue), methylated (red), or not sequenced (gray). At least 10 alleles were analyzed for each template DNA (rows). In (e) and (f) the CpG methylation data were obtained from Zylicz et al. 201545.

