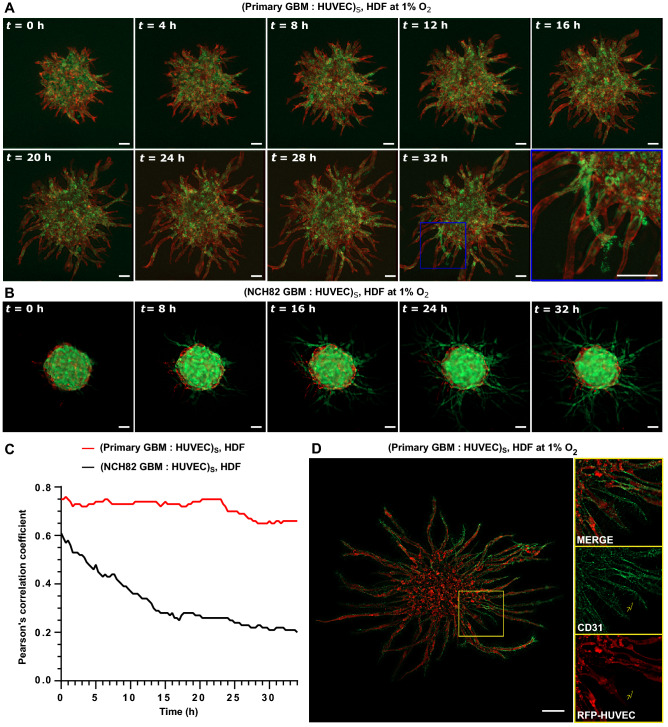
Figure 4.
Time-lapse imaging showing evolution of GBM: HUVEC spheroid with HDF as the supporting cell at 1% O2 over a period of 32 h. (A) Primary GBM (green) : HUVEC (red) spheroid. (B) NCH82 GBM (green) : HUVEC (red) spheroid. t = 0 h is taken at day 1 after seeding. HDF cells are non-fluorescent. The spheroids and single HDF cells are embedded in a 7.5 mg/mL fibrin gel. (C) Plot showing Pearson’s correlation coefficient as a function of culture time. Similar results were obtained in three independent experiments. (D) CD31 immunohistochemical staining (green) of primary GBM : HUVEC spheroid at day 3 after seeding. Right images are magnified views of the selected area (yellow box). The scale bars represent 100 m. Subscript S denotes cells seeded in the same spheroid.

