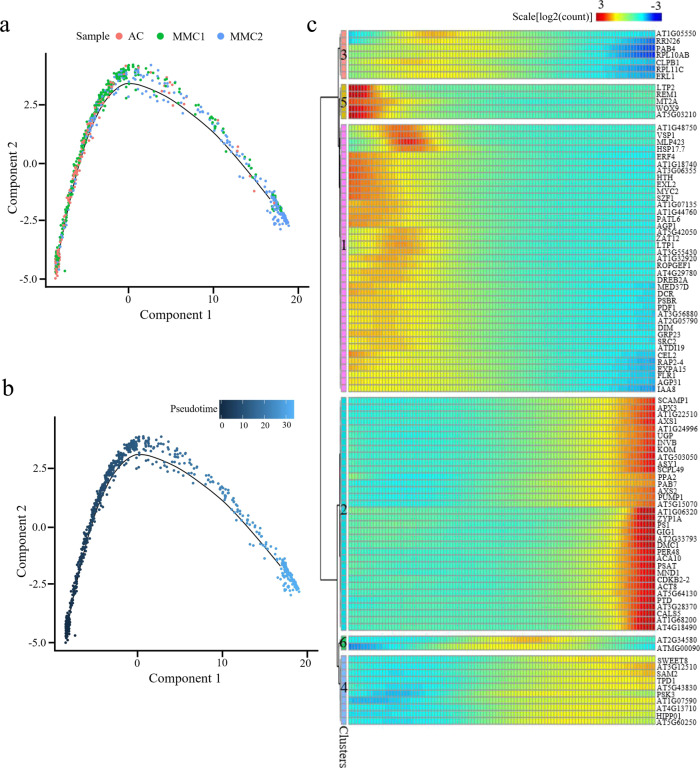
Fig. 7. Reconstruction of the differentiation trajectory in a pseudotime manner.
a, b Pseudotime trajectory of the cluster 11. The horizontal and vertical coordinates are two principal components, and the dots on the way represent different cells, in which different colors represent the sample identity (a) or the pseudotime (b). The color from darkest blue to lightest blue (b) represents pseudotime from beginning to end. c Expression heatmap of the top 100 DEGs across pseudotime. The abscissa is in quasi-chronological order, and the ordinate represents one gene per row. Each column represents the average expression value under the current cell state. Rows were grouped based on similarity in gene expression, resulting in six clusters indicated left. The color bar indicates the relative expression level.

