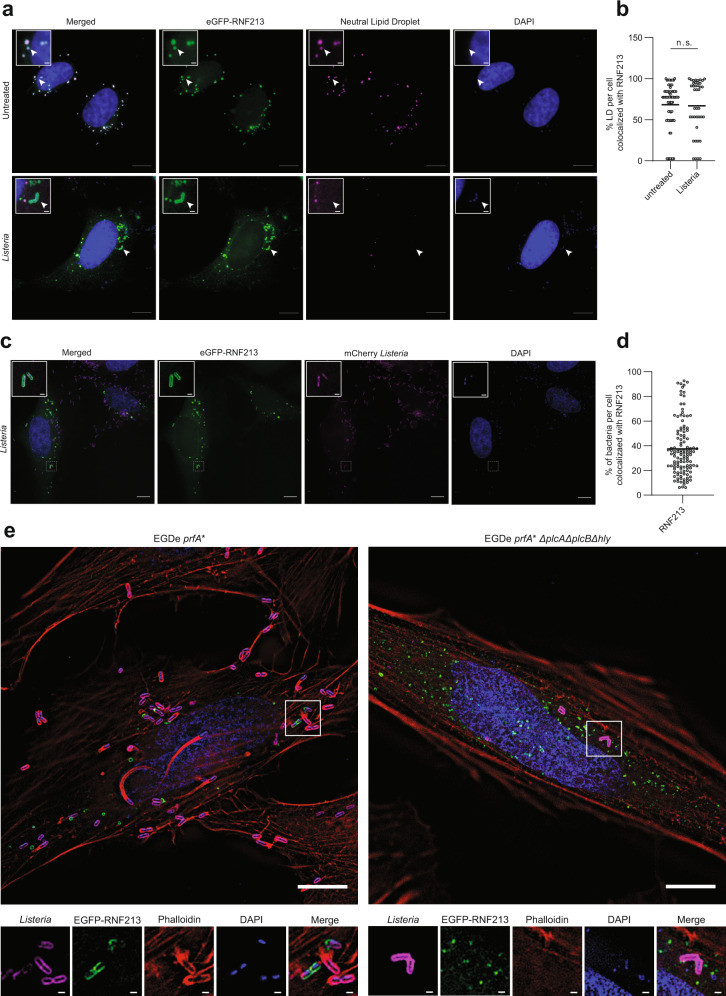
Fig. 8. RNF213 decorates intracellular Listeria.
a Representative images of HeLa cells transfected with eGFP-RNF213 and counterstained for lipid droplets (LDs). Following transfection cells were left untreated or infected with Listeria monocytogenes EGD for 24 h at MOI 25. Scale bars in the pictures and insets are respectively 10 microns and 1 micron. White arrows indicate colocalization between RNF213 and lipid droplets or instances of RNF213 colocalization with intracellular bacteria (DAPI = 4′,6-diamidino-2-phenylindole). b LDs in uninfected (n = 66 cells) and Listeria-infected cells (n = 40 cells) from a were quantified with Fiji and the percentage of LDs per cell that colocalized with RNF213 was calculated (representative results from a single experiment, two-tailed unpaired t-test, AVG uninfected = 68.29%, AVG Listeria-infected = 67.14%, n.s. = not significant). c Representative images of HeLa cells transfected with eGFP-RNF213 and infected for 18 h with Listeria monocytogenes EGD stably expressing mCherry. Scale bars in the pictures and insets are respectively 10 microns and 0.5 micron. d Intracellular Listeria from c were quantified with Imaris 9.6 and the percentage of Listeria that was decorated by eGFP-RNF213 was calculated for each field by mapping the cell surface, enumerating intracellular bacteria and quantifying bacteria that colocalized with GFP-RNF213 (defined as bacteria within 0.5 µm of RNF213, see methods for more detail). At least 200 cells were counted per experiment, and data were compiled from three independent experiments indicating that on average 37.44% of Listeria was decorated by RNF213. e (left panel) Representative image of HeLa cells transfected with eGFP-RNF213 and infected with Listeria monocytogenes EGDe prfA* at MOI 1 for 6 h. Scale bar in the picture and insets is 10 microns. Inset demonstrates colocalization of RNF213 to the surface of cytosolic bacteria. Nuclei are shown in blue, RNF213 in green, actin in red, and bacteria in magenta. Scale bar is 1 micron. (right panel) Representative image of HeLa cells transfected with eGFP-RNF213 and infected with Listeria monocytogenes EGDe prfA*∆plcA∆plcB∆hly at MOI 75 for 6 h. Scale bars in the picture and insets are respectively 10 microns and 1 micron. Source data are provided as a Source Data file.

