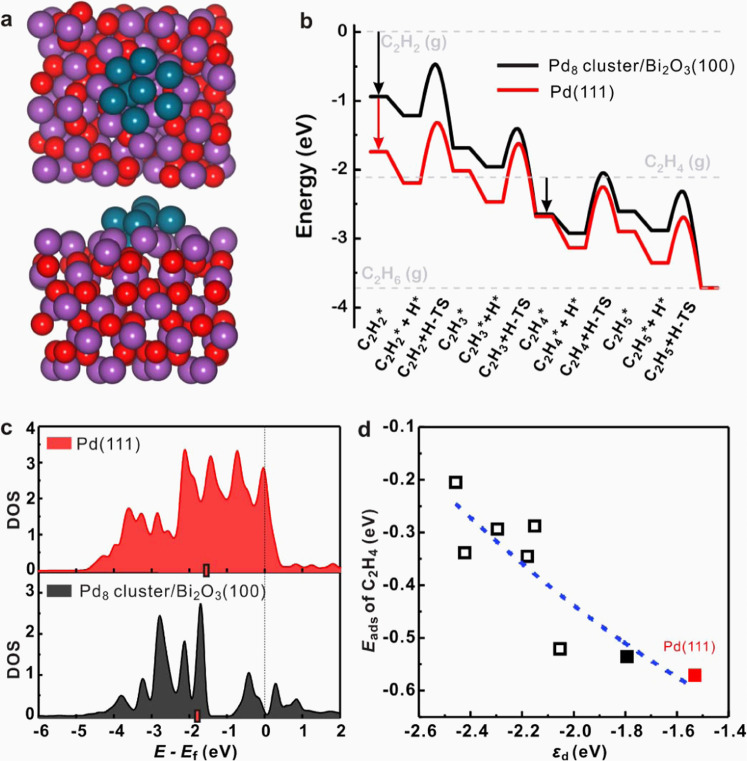
Fig. 4. Reaction mechanism revealed by DFT calculations.
a Optimized Pd cluster structure for DFT calculation (Pd: cyan, Bi: purple, O: red) and b energy profile of acetylene hydrogenation to ethane on Pd(111) and Pd8 cluster supported on Bi2O3(100). c DOS projected onto d electrons over Pd atom of Pd(111) and Pd8 cluster structures. A surface Pd atom of Pd(111), and the most active Pd atom of Pd8 cluster structure (on which C2H4 adsorbs most strongly) are chosen to plot the DOS. The position of d-band center (εd) is highlighted with a red bar. d Eads of C2H4 as a function of εd over different Pd atom on Pd cluster surface (black squares). The most stable adsorption configuration is shown as solid square, while the other less stable adsorption structures are denoted by hollow squares. A surface Pd atom of Pd(111) is also shown as red solid square for comparison. The blue fitted line is a guide for the eyes. It shows that a more negative εd corresponds to a more positive Eads of C2H4. Source data are provided in a Source data file.

