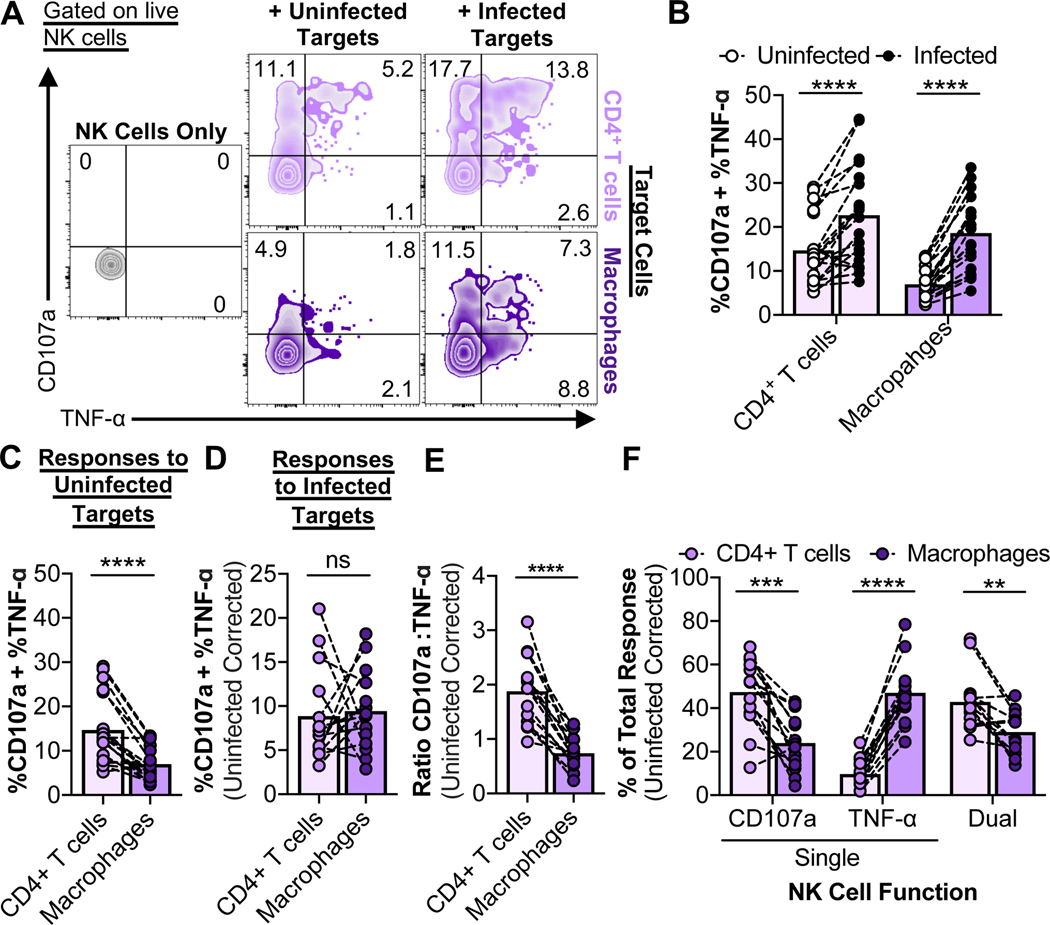
Fig. 2. Initial NK cell responses to HIV-infected macrophages are skewed towards TNF-α production over degranulation.
NK cell innate-based recognition of HIV-infected targets. NK cells were incubated with targets at a target-to-effector ratio of 10 for 6 hours, followed by flow cytometry analysis of degranulation/CD107a and TNF-α production. (A) Representative NK cell recognition assay plots. (B) Data summaries for NK cell responses (%CD107a + %TNF-α) to uninfected and infected targets from twelve independent experiments (n=19 biological replicates). (C) Comparison of NK cell responses to uninfected CD4+ T cells and macrophages from twelve independent experiments (n=19 biological replicates). (D) Comparison of NK cell responses to infected CD4+ T cells and macrophages. Values are corrected for background recognition of uninfected target cells and normalized to target cell infection frequencies. NK cell responses that were less than 2% above background (n=5) were excluded from the analysis. (E and F) Data summaries for the quality of the NK cell response to infected CD4+ T cells and macrophages. Values are corrected for background recognition of uninfected target cells. (E) Ratios of CD107a versus TNF-α production were calculated as described in the STAR Methods. Shown are results from ten independent experiments (n=14 biological replicates). (F) The “% Total Response” was calculated as described in the STAR Methods. Values are corrected for background recognition of uninfected target cells. Shown are results from ten independent experiments (n=14 biological replicates). Statistical analysis for (B-F): paired t tests, **p<0.01, ***p<0.001, ****p<0.0001, ns=not significant. See also Fig. S2.

