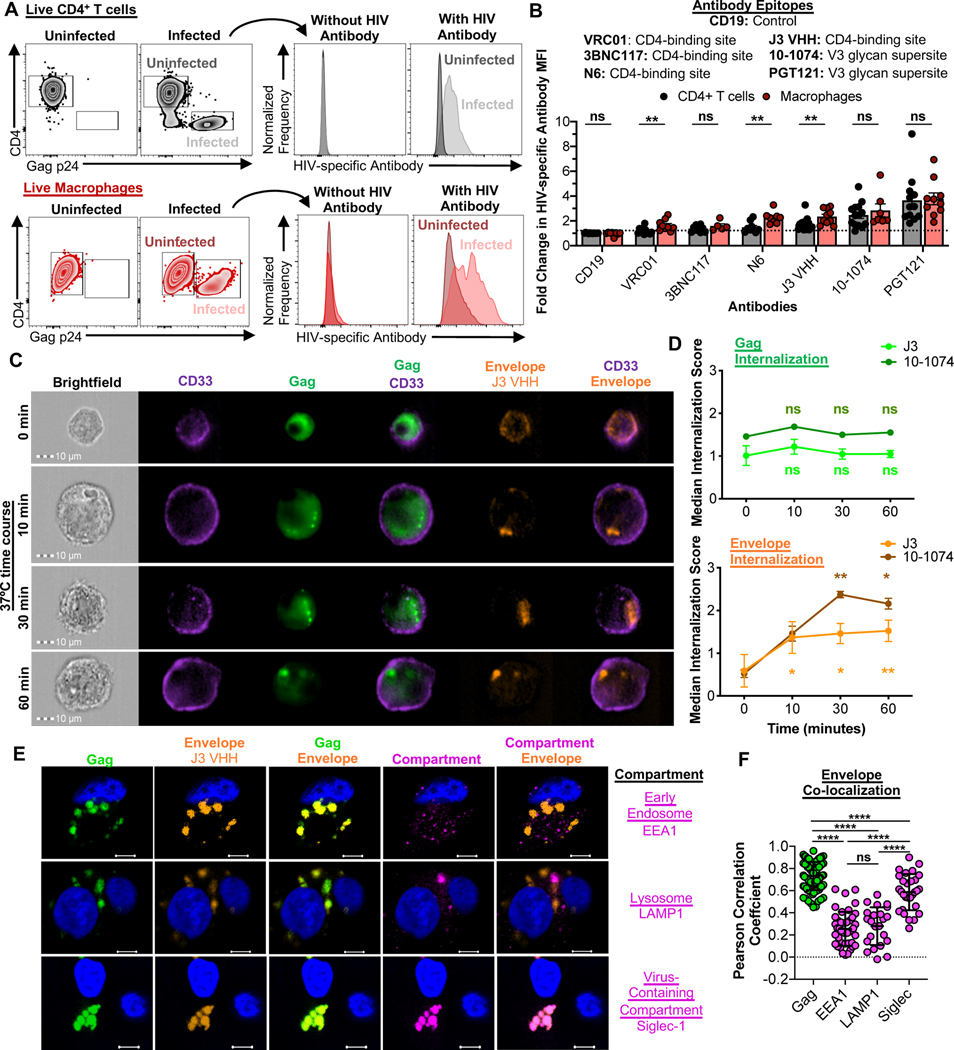
Fig. 3. HIV assembles into plasma membrane contiguous VCCs in macrophages, but the HIV envelope is also transiently accessible at the cell surface.
(A and B) HIV antibody-based detection of the HIV envelope on the surface of infected CD4+ T cells and macrophages. (A) Representative flow cytometry plots of uninfected and infected CD4+ T cells (black) and macrophages (red) stained with HIV envelope-specific antibodies. Histograms of HIV-specific antibody staining show the shifts in MFI between the uninfected and infected populations. (B) Summary of the “Fold change in HIV-specific Antibody MFI” for each antibody for HIV89.6-infected CD4+ T cells and macrophages. This fold change was calculated as described in the STAR Methods. Data were collected across a total of 23 independent experiments. Statistical analysis, unpaired t test, **p<0.01, ns=not significant. (C and D) Kinetics of the HIV envelope internalization on infected macrophages. (C) Representative images of the Gag+Envelope+ population over the 60-minute time course showing the distribution of CD33, the HIV Gag and the envelope. Additional representative images of 10–1074 staining are shown in Fig. S3C. (D) Summary of the internalization scores over the 60-minute time course for the Gag and Envelope. Shown are the mean +/− SEM data from 7 independent experiments (J3 VHH staining; n=8 biological replicates) and 3 independent experiments (10–1074 staining; n=3 biological replicates). Statistical analysis: paired t test between the 0-minute time point and the 10, 30 and 60-minute time points within either the J3 VHH or 10–1074 groups, *p<0.05, **p<0.01, ns=not significant. (E and F) Characterization of the internalized HIV envelope on infected macrophages using confocal microscopy. (E) Representative images of infected macrophages stained for the HIV Gag and Envelope (J3 VHH) and compartment markers EEA1 (top row), LAMP1 (middle row), or Siglec-1 (bottom row). Blue staining is Hoescht/Nuclei. The bar denotes 10μm. (F) Summary of the HIV Envelope co-colocalization with the HIV Gag, EEA1, LAMP1, and Siglec-1. Shown are the calculated Pearson Correlation Coefficients for the Envelope vs Gag (n=106 images over 14 independent experiments), Envelope vs EEA1 (n=42 images over 7 independent experiments), Envelope vs LAMP1 (n=23 images over 3 independent experiments), and Envelope vs Siglec-1 (n=29 images over 7 independent experiments). Statistical analysis: unpaired t test, ****p<0.0001, ns=not significant. See also Fig. S3.

