
Fig. 1.
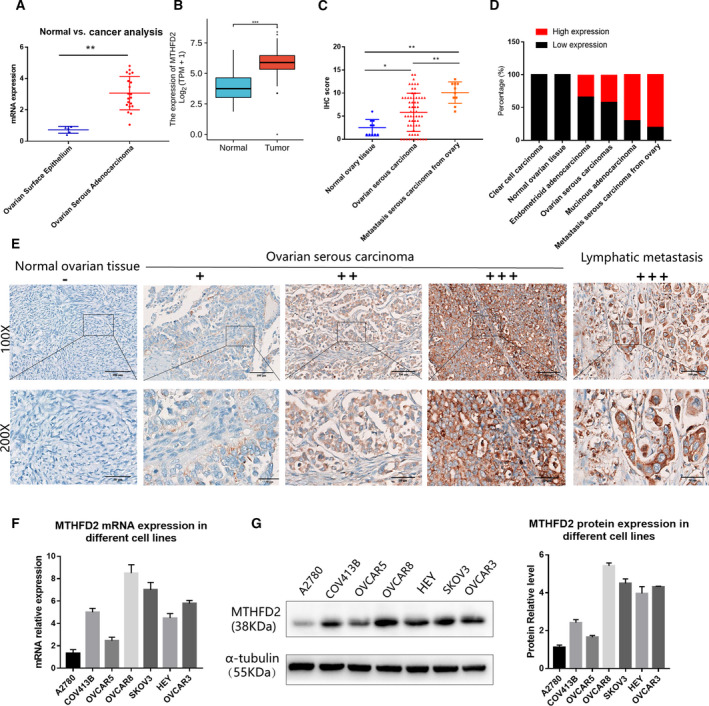
MTHFD2 is highly expressed in ovarian cancer tissues and cell lines. (A) MTHFD2 mRNA expression in datasets of Lu Ovarian Statistics dataset from Oncomine database. (B) Unpaired tissues of MTHFD2 expression in TCGA and GTEx databases. (C) The expression of MTHFD2 was examined by IHC. The IHC staining score was higher in ovarian serous carcinoma than in normal ovarian tissues; besides, it was significantly higher in lymph node metastasis carcinomas from ovary. (D) The percentages of tissues with high or low‐expression of MTHFD2 in normal ovarian tissues, ovarian serous carcinoma, mucinous adenocarcinoma, endometrioid adenocarcinoma, clear cell carcinoma, and lymph node metastasis carcinomas. (E) Representative images of MTHFD2 IHC staining in normal ovarian tissue, ovarian serous carcinomas, and lymph node metastasis carcinoma. (−) no staining; (+) weak staining; (++) moderate staining; (+++) strong staining. (F) Expression of MTHFD2 mRNA in ovarian cancer cell lines as detected by qPCR. (G) Expression of MTHFD2 protein in ovarian cancer cell lines as detected by western blot. Data were analyzed using Student's t‐test. Results are shown as mean ± standard deviation of three independent experiments [Scale bar = 100 μm (100×), Scale bar = 50 μm (50×), *P < 0.05, **P < 0.01, ***P < 0.001].