Fig. 1.

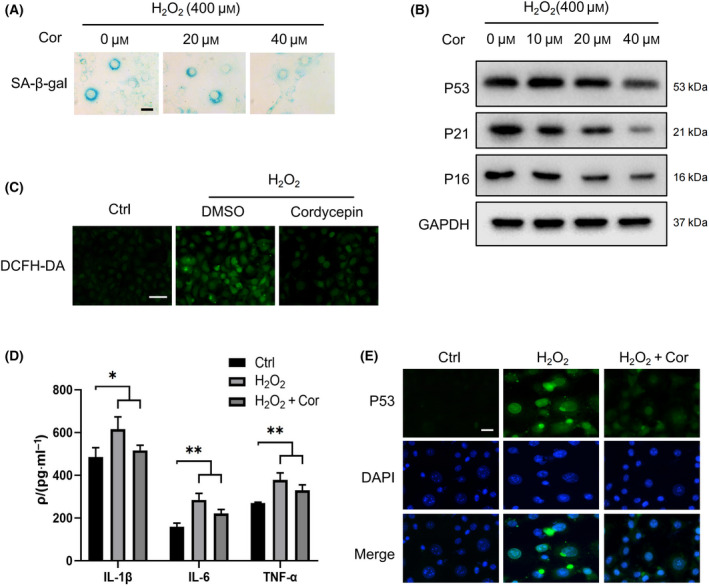
Cordycepin delays cell senescence. (A) NIH3T3 cells were stained using a SA‐β‐gal assay kit after treatment with 400 μm H2O2 for 72 h, and representative images were selected from three independent tests. Scale bars = 20 μm. (B) Western blot (WB) image of aging marker proteins P53, P21, and P16 in NIH3T3 cells after hydrogen peroxide treatment at different concentrations. (C) DCFH‐DA fluorescence was used to measure the amounts of intracellular reactive oxygen species (ROS). Scale bars = 100 μm. (D) ELISA was used to detect different levels of pro‐inflammatory factors in the control group, senescence group, and cordycepin treatment group. (E) The immunofluorescence images show the changes in the senescence marker protein P53 in the control group, the senescence group, and the cordycepin treatment group. Scale bars = 50 μm. Representative images of three independent experiments are presented. Data were analyzed using Student’s t‐test and are presented as the mean ± SD. *P < 0.05, **P < 0.01. The following concentrations were used in the treatments depicted in C, D, and E: H2O2 (400 μm) and cordycepin (40 μm).
